XAUUSD Technical Analysis: The Ultimate Guide for Gold Traders (2026)#

If you want to trade gold with consistency, you need a framework that matches how gold actually moves in real sessions, not a copy-paste forex template. This guide to XAUUSD technical analysis gives you that framework: market structure, indicator settings many practitioners use, and an execution checklist.
This article is for educational purposes only and does not constitute investment advice. Past performance is not indicative of future results. Trading XAUUSD involves significant risk of loss.
What Is XAUUSD Technical Analysis?#
At its core, technical analysis is the process of reading price behavior, momentum, and market structure to make better trading decisions. For gold traders, this means interpreting XAUUSD charts through trend direction, support/resistance zones, volatility conditions, and timing around major sessions.
XAUUSD represents the value of one troy ounce of gold priced in U.S. dollars. Because one side of the pair is a hard asset and the other is the world’s reserve currency, price action often reflects both risk sentiment and macro repricing.
Gold also trades with unique character compared with major forex pairs. In early March 2026, daily movement has often stretched across a much wider dollar range than pairs like EURUSD or GBPUSD. That wider movement creates opportunity, but it also punishes weak stop placement and late entries.
Here is a simple comparison you can use when adjusting expectations:
| Instrument | Typical Daily Movement Profile | Volatility Character | Session Sensitivity | Practical Implication |
|---|---|---|---|---|
| XAUUSD | Higher intraday expansion in dollar terms | Fast impulse + deep pullback behavior | Very high in London and New York | Needs wider stop logic and stronger timing discipline |
| EURUSD | Generally smoother intraday progression | Moderate | High but less explosive than gold | Works better with tighter intraday stops |
| GBPUSD | Often event-driven and spiky | Medium-high | Strong London response | Can trend well, but usually less extreme than gold |
| USDJPY | Yield and risk-on/risk-off responsive | Medium | Strong in Asia and NY | Cleaner trend days, fewer gold-style whipsaws |
Gold’s relationship with the U.S. dollar is another reason chart analysis matters. Historically, XAUUSD and the DXY move with a strong inverse relationship, often observed in a broad range around -0.7 to -0.9 depending on the period measured. You do not need to compute correlation coefficients every day, but you do need to recognize when a dollar impulse is likely to pressure or support gold momentum.
For newer traders, this is where foundational education helps. If you need a full starting map of broker setup, lot size, and execution basics, read the complete beginner's guide to gold trading. If you want the short practical version, use this how to start trading gold XAUUSD walkthrough first.
Finally, technical analysis is not prediction. It is probability management.
Essential Technical Indicators for Gold Trading#
Indicators are tools, not trading systems. The best results usually come from combining trend, momentum, and volatility information in one decision flow. For gold, many experienced traders prefer slight adjustments to standard settings because XAUUSD can move sharply and fake out standard thresholds.
Before diving into each tool, here is a high-level settings table using commonly used practitioner preferences rather than absolute rules.
| Indicator | Standard Setting | Commonly Used Gold Preference | Why Traders Adjust |
|---|---|---|---|
| EMA | 50/200 | 50/200 (trend) + 20/50 (structure) | Separates long trend from tactical pullbacks |
| RSI | 14 with 30/70 | 14 with 25/75 in volatile phases | Filters minor noise during strong impulses |
| MACD | 12,26,9 | 8,17,9 for faster momentum read | Reacts quicker in expansion candles |
| Bollinger Bands | 20,2 | 20,2 (some use 20,2.1) | Tracks squeeze-to-expansion shifts |
| ATR | 14 | 14 with 1.5x–2x ATR stop logic | Better fit for wider gold swings |
| Stochastic | 14,3,3 | 14,3,3 intraday only | Useful in ranges, weak in aggressive trends |
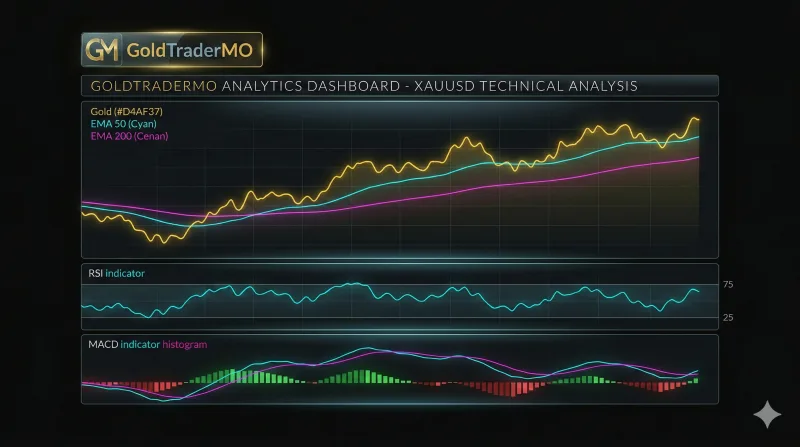
Trend tools: EMA structure first#
For most traders, EMA structure is the backbone. The 50/200 EMA relationship on H4 and D1 is widely followed for directional bias. When price holds above both averages and pullbacks remain shallow, many traders treat dips as continuation opportunities. When price loses both and fails retests, caution rises quickly.
A practical workflow:
- Use D1 EMA 50/200 to define directional bias.
- Use H4 EMA 20/50 to identify pullback structure.
- Ignore lower timeframe entries that conflict with higher timeframe bias unless you are explicitly trading a mean-reversion setup.
This alone can reduce random entries. You are no longer reacting to every candle; you are filtering by context.
Momentum tools: RSI and MACD in combination#
RSI (14) remains one of the most useful gold momentum tools when interpreted with structure. Many experienced gold traders prefer 25/75 zones in strong trend periods because 30/70 can trigger too early during aggressive moves. In ranges, standard thresholds still work fine.
How to use RSI with structure:
- In uptrends, watch for RSI pullbacks holding above the midline and bullish divergence near support.
- In downtrends, watch for RSI failures near resistance and bearish divergence after weak retests.
- Treat overbought/oversold as context, not automatic reversal signals.
MACD helps confirm acceleration and deceleration. Standard 12,26,9 is stable; faster 8,17,9 can be helpful when gold is moving quickly and you need earlier momentum confirmation. Either can work if you stay consistent.
A common mistake is taking every crossover. Better approach: use crossovers only when they align with higher timeframe structure and key levels.
Volatility tools: Bollinger Bands and ATR#
Gold can switch from compression to expansion quickly. Bollinger Bands (20,2) help you visualize that transition. During a squeeze, bands tighten and momentum may stall; when expansion begins with directional conviction, bands widen and trend continuation setups often become cleaner.
ATR is even more practical because it directly influences risk placement. Many traders use around 1.5x to 2x ATR for stop-loss distance in gold to avoid getting clipped by routine noise.
Example (conceptual):
- If H1 ATR is elevated, placing a very tight stop just below a minor wick is often low quality.
- If D1 ATR is expanding into event week, reduce position size instead of forcing the same lot size with wider stops.
Gold-focused indicator combinations#
No combination guarantees outcomes, but some are widely used because they support better decision structure.
| Rank | Combination | Relative Reliability | Best Timeframe | Practical Use |
|---|---|---|---|---|
| 1 | EMA 50/200 + RSI divergence | ⭐⭐⭐⭐⭐ | H4 / D1 | Trend-aligned pullbacks and reversals at major zones |
| 2 | Bollinger squeeze + MACD confirmation | ⭐⭐⭐⭐ | H1 / H4 | Breakout continuation after compression |
| 3 | EMA 20/50 + ATR-based stop model | ⭐⭐⭐⭐ | H1 / H4 | Structured trend continuation with risk control |
| 4 | Stochastic + range boundaries + ATR filter | ⭐⭐⭐ | M15 / H1 | Intraday range trades in lower-volatility windows |
🔍 How to Verify These Settings Yourself:
- Open a demo account on MT4/MT5 or TradingView
- Apply each indicator with the settings discussed above
- Backtest on at least 6 months of XAUUSD H4/D1 data
- Track win/loss ratio, average R:R, and maximum drawdown
- Compare gold-tuned settings vs standard settings on the same data
- Only trade live after achieving consistent demo results
The main edge comes from sequencing, not indicator count. One effective sequence is:
- Trend filter (EMA structure)
- Location filter (support/resistance)
- Trigger filter (RSI/MACD behavior)
- Risk filter (ATR-based stop and position size)
If you want tactical intraday execution ideas to complement this section, this 5-minute gold scalping strategy can help you map lower-timeframe triggers.
Indicator settings and combinations discussed are based on practitioner experience and historical observation. Results vary by market conditions, timeframe, and individual trading approach. Always backtest strategies before live trading.
Chart Patterns and Price Action#
Indicators help, but price action still leads. In gold trading, chart patterns become much more useful when they form at meaningful zones and align with session momentum.
Why pattern context matters more than pattern labels#
A textbook pattern in the middle of random range noise has limited value. The same pattern at major support, with momentum confirmation and session participation, can become a high-quality setup.
For practical execution, evaluate each pattern through three filters:
- Location: Is it forming near key support/resistance, Fibonacci, or dynamic EMA structure?
- Participation: Is it developing during active windows (London, NY, overlap) or dead liquidity periods?
- Confirmation: Do you see confirming behavior in momentum or candle closes?
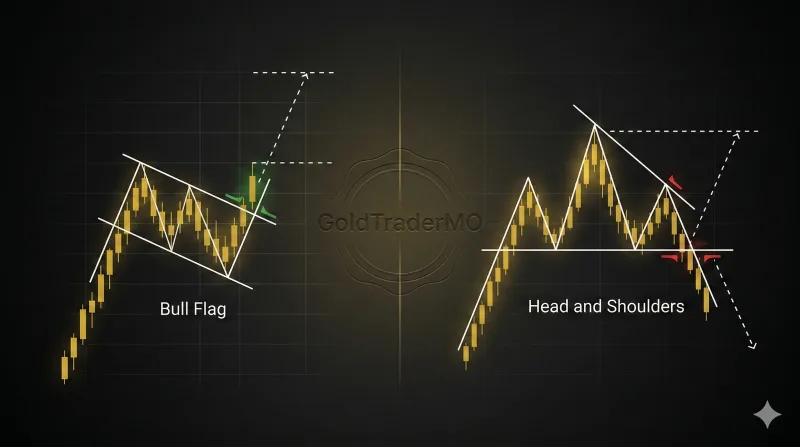
Common XAUUSD patterns and how traders use them#
| Pattern | Type | Best Timeframe | Typical Reliability (Relative) | Gold-Specific Note |
|---|---|---|---|---|
| Bull Flag | Continuation | H4 / D1 | ⭐⭐⭐⭐⭐ | Often follows strong London/NY impulse legs |
| Ascending Triangle | Continuation | H1 / H4 | ⭐⭐⭐⭐ | Watch breakout behavior near round numbers |
| Head & Shoulders | Reversal | D1 / W1 | ⭐⭐⭐⭐ | Usually cleaner on higher timeframes |
| Double Bottom / Top | Reversal | H4 / D1 | ⭐⭐⭐⭐ | Stronger when aligned with confluence zones |
| Asian Range Breakout | Continuation | M15 / H1 | ⭐⭐⭐ | Better when London momentum confirms |
Chart pattern success rates (relative framework)#
Because precise percentages are highly data-dependent across broker feed, spread conditions, and sample selection, a relative framework is more realistic:
| Pattern Family | Typical Outcome Quality | Failure Risk | Best Filter Combination |
|---|---|---|---|
| Trend Continuation (flags, triangles) | High when trend is established | Medium | EMA trend + momentum confirmation |
| Reversal (H&S, double top/bottom) | Medium to high on higher TF | Medium-high | Strong S/R + divergence + close confirmation |
| Breakout from Compression | Medium to high in active sessions | High if low liquidity | Session timing + volatility expansion check |
| Range Mean Reversion | Medium in quiet sessions | High during news impulses | Clear boundaries + strict invalidation |
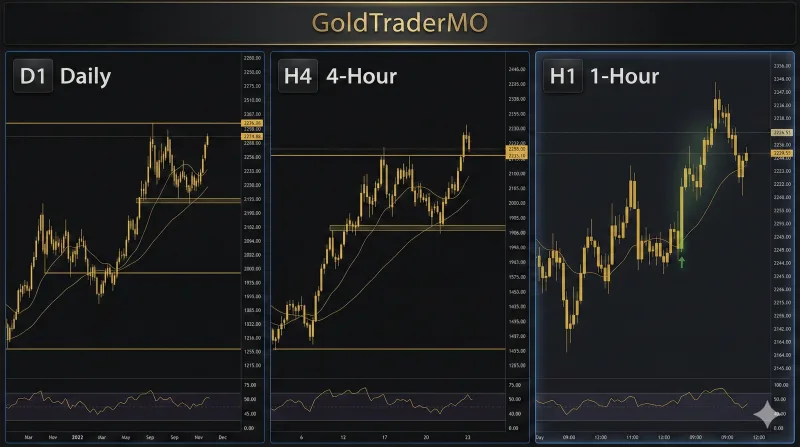
Practical pattern example using March 2026 context#
Assume gold is trading around the $5,333 area and has rallied from a lower support zone earlier in the week. On H4, price begins consolidating below resistance, forming a flag-like structure. Your process might look like this:
- D1 trend still points upward above major moving averages.
- H4 prints higher lows inside consolidation.
- H1 momentum softens but does not fully break bearish.
- London or NY opens with expansion candle that closes above local structure.
That setup is not “guaranteed,” but it is a structured continuation attempt.
Pattern traders also benefit from studying failed setups. Failed breakouts around round numbers can produce some of the strongest reversals in gold. If breakout candles immediately reject and momentum fails to follow through, flipping bias can be more rational than defending the original idea.
For traders who focus on short-duration execution and pattern timing, this gold scalping strategy guide offers a practical lens for pattern-to-trigger conversion.
Support, Resistance, and Fibonacci#
If you only master one part of chart reading for gold, make it level mapping. Most high-quality setups in XAUUSD happen where price meets decision zones with real order flow.
Static support and resistance#
Round numbers are widely watched in gold because they act as psychological magnets. In the current cycle, levels like $5,000, $5,100, $5,200, $5,500, and $6,000 naturally attract attention from both retail and institutional participants.
You should not assume every touch creates a reversal. Instead, think in scenarios:
- First touch at a major level can trigger reaction.
- Repeated tests weaken level integrity.
- Break-and-hold behavior often matters more than initial spike.
Dynamic support and resistance#
Dynamic levels move with price and trend. The EMA 50 and EMA 200 on H4/D1 are commonly used as moving support/resistance references. In bullish structure, pullbacks into these dynamic zones can offer continuation opportunities if momentum confirms.
Static and dynamic confluence is where decision quality often improves. Example: a pullback into a prior breakout level that also aligns with EMA support can be stronger than either level alone.
Fibonacci in gold trading#
Fibonacci retracement remains one of the most used tools for gold pullback analysis. The 38.2%, 50%, and 61.8% levels are commonly monitored by practitioners, with 61.8% often treated as a deeper pullback zone that can still preserve trend structure.
Use Fibonacci as a map, not a signal. A level by itself is not enough. Confluence with structure, candle behavior, and momentum context makes the setup more meaningful.
| Fibonacci Level | Typical Use | Gold Application Note |
|---|---|---|
| 23.6% | Shallow pullback | Often passed in strong corrective waves |
| 38.2% | Moderate pullback | Common in healthy trend continuation |
| 50.0% | Midpoint reference | Widely watched even though not a Fibonacci ratio |
| 61.8% | Deep pullback zone | Frequently monitored for trend defense attempts |
| 78.6% | Late-stage pullback | Breaks beyond this can warn of trend transition |
Current key levels (March 2026)#
Approximate, subject to change with live market conditions.
| Level | Type | Significance |
|---|---|---|
| $5,000 | Major Support | Psychological anchor and major reaction zone |
| $5,100–$5,200 | Support Zone | Frequently monitored pullback area |
| $5,333 | Current Reference | Approximate early-March operating area |
| $5,390–$5,418 | Resistance Zone | Recent upper boundary and breakout decision area |
| $5,500 | Round Number Resistance | Next major psychological objective |
| $6,000 | Long-Term Psychological Target | Strategic macro focus level for many traders |
XAUUSD support resistance workflow you can apply daily#
- Mark D1 and H4 swing highs/lows.
- Add major round numbers.
- Overlay EMA structure and Fibonacci retracements.
- Identify confluence zones, not single lines.
- Build “if-then” scenarios before session open.
This week’s context can change quickly with macro headlines, so it helps to pair your level map with tactical updates from this week's gold market preview.

Multi-Timeframe Analysis#
A lot of traders lose consistency because they mix signals from random timeframes. Multi-timeframe structure solves this by assigning each chart a clear job.
A practical top-down sequence:
- W1/D1: Direction and macro structure
- H4: Setup zone and pullback quality
- H1/M15: Entry trigger and risk placement
When all layers align, setup quality tends to improve because you are no longer taking isolated lower-timeframe signals against higher-timeframe pressure.
MTF framework by trading style#
| Trading Style | Entry TF | Bias TF | Structure TF | Core Indicator Stack |
|---|---|---|---|---|
| Scalping | M5 | M15 | H1 | EMA 9/21 + Stochastic + session timing |
| Day Trading | H1 | H4 | D1 | MACD + RSI + key level confluence |
| Swing Trading | H4 | D1 | W1 | EMA 50/200 + ATR + major S/R map |
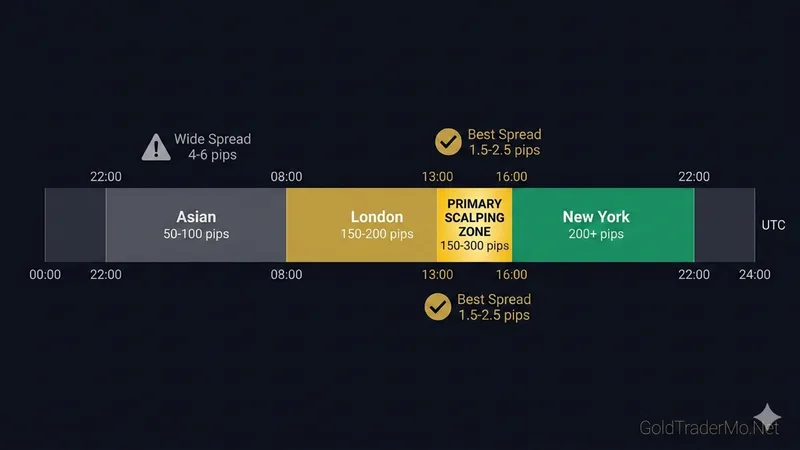
Session characteristics that shape execution#
| Session | UTC Hours | Volatility Profile | Typical Behavior |
|---|---|---|---|
| Asian | 22:00–08:00 | Low | Consolidation and range behavior |
| London | 08:00–16:00 | High | Breakout attempts from prior range |
| New York | 13:00–22:00 | Very High | Strong directional moves and continuation |
| London–NY Overlap | 13:00–17:00 | Peak | Highest liquidity and momentum potential |
The New York session typically drives the largest part of daily directional movement in gold, especially on macro days.
A practical example of top-down alignment#
Suppose your weekly chart remains bullish and daily structure still holds above major support. On H4, price pulls back into a confluence zone near prior breakout structure and a Fibonacci midpoint. H1 then prints bullish rejection candles while momentum stabilizes.
That sequence gives you:
- Trend alignment from higher timeframe
- Structured location from mid timeframe
- Trigger logic from execution timeframe
If any one piece is missing, pass or reduce size.
Common MTF mistakes#
- Entering from M5 while D1 is at major resistance with no confirmation.
- Forcing continuation trades late in NY after full-day expansion.
- Switching timeframe every few minutes to justify an emotional bias.
- Ignoring spread/volatility shifts around high-impact data.
Building your repeatable system#
A repeatable system is about repeatable decisions:
- Same pre-session map
- Same setup definitions
- Same risk model
- Same review process
If you trade fast intraday windows, a 5-minute scalping setup can plug directly into the MTF model above as your execution layer. If you rely on directional context and market bias, this gold trading signals reference can support confirmation.
Multi-timeframe analysis and session-based strategies are educational frameworks, not guaranteed trading systems. Past market behavior does not predict future outcomes.
Your XAUUSD TA Checklist + Risk Management#
Most trading mistakes happen before entry, not after it. A pre-trade checklist forces discipline and removes emotional shortcuts.
Pre-trade checklist (quick reference)#
| Step | Action | Tool | What to Look For |
|---|---|---|---|
| 1 | Define trend bias | EMA 50/200 on D1 | Price structure aligned with direction |
| 2 | Mark decision zones | S/R + round numbers + Fibonacci | Confluence areas, not isolated lines |
| 3 | Validate setup | Pattern + candle behavior | Context at level, not random pattern |
| 4 | Confirm trigger | RSI/MACD on execution TF | Momentum agreement with setup logic |
| 5 | Lock risk plan | ATR + position size model | Predefined stop, target, and invalidation |
Risk management (non-negotiable)#
Risk management should be as visible as your entry setup. Many traders improve their analysis and still lose because they scale size emotionally.
Core rules used by many disciplined traders:
- Risk a small fixed percentage per trade (often around 1% and rarely above 2%).
- Use ATR-informed stop placement to match current volatility.
- Target at least asymmetric payoff structure where reward outweighs risk.
- Set a daily max-loss threshold and stop trading when hit.
- Avoid stacking multiple highly correlated gold exposures at once.
A practical approach around current conditions (gold near $5,333 context):
- If volatility expands into news sessions, reduce size first.
- If setup quality is average, reduce size or skip.
Seven common gold TA mistakes#
- Trading every indicator crossover without level context.
- Entering against higher timeframe structure because M5 “looks good.”
- Placing stops inside obvious noise zones in high ATR conditions.
- Chasing breakout candles after the move is already extended.
- Ignoring session timing and trading low-liquidity chop as if it were trend.
- Averaging into losing positions without structural invalidation logic.
- Skipping journal review and repeating the same execution errors.
Your weekly improvement loop#
To turn this guide into results, use a simple loop each week:
- Review your best and worst three trades.
- Tag each trade by trend quality, location quality, trigger quality, and risk quality.
- Keep strategy constant long enough to evaluate it fairly.
Technical skill and psychology are linked. If you struggle with discipline after losses or impulsive entries during volatility, this guide on trading psychology for gold is a useful companion.

By now, you have a complete operating map for XAUUSD technical analysis: trend structure, indicator usage, pattern context, level confluence, timeframe alignment, and risk execution. If you apply these consistently, your decision quality can improve even when outcomes vary trade to trade.
Risk Disclaimer: Trading gold (XAUUSD) is highly speculative and involves substantial risk of loss. The strategies and analysis in this guide are for educational purposes only. Never trade with money you cannot afford to lose. Consider your financial situation and risk tolerance before trading.
FAQ#
1) What is the best indicator for XAUUSD trading?
There is no single “best” indicator for every condition. Many traders start with EMA 50/200 for trend direction, then use RSI and MACD for momentum confirmation. Volatility tools like ATR help with stop placement. In practice, combinations are usually more reliable than standalone signals.
2) What timeframe is best for gold technical analysis?
For many traders, H4 and D1 provide the strongest signal-to-noise balance. Scalpers may execute on M5 or M15, but they still benefit from checking H1/H4 direction first. Swing traders generally prioritize D1 and W1 to avoid lower-timeframe noise.
3) How do you read XAUUSD support resistance levels?
Start with major swing highs/lows on D1 and H4, then layer round numbers and Fibonacci zones. Next, check whether momentum confirms reaction at those levels. Levels are zones of decision, not automatic reversal points.
4) What is a golden cross in XAUUSD?
A golden cross occurs when a shorter moving average (commonly 50) crosses above a longer one (commonly 200). Many traders treat it as a long-bias confirmation signal. It is more useful when aligned with broader trend structure and not used in isolation.
5) Is RSI 25/75 better than 30/70 for gold?
Some experienced gold traders prefer 25/75 in high-volatility environments to filter weaker extremes. Others keep 30/70 and rely more on structure and divergence. The better setting is the one you backtest consistently on your timeframe and risk model.
6) Which Fibonacci levels are most watched in gold trading?
The 38.2%, 50%, and 61.8% retracement zones are widely monitored. The 61.8% level is often viewed as a deeper pullback area that can still preserve trend structure. Confirmation from price action and momentum remains essential.
7) How does DXY affect gold prices?
Gold and the U.S. Dollar Index are commonly observed with a strong inverse relationship over many periods. When the dollar strengthens sharply, gold may face pressure; when the dollar weakens, gold often finds support. Correlation can vary in short windows, so context still matters.
8) How many timeframes should I use for a trading decision?
A practical rule is two to three: one for trend, one for setup, one for trigger. This keeps analysis structured without overload. Too many timeframes can create indecision and confirmation bias.