
Weekly Market Overview#
Gold fell through $4,000 this week, and Gold Trader Mo’s public record followed it down. Across October 19–23, 2026, the fully specified public plans on the @GTMO channel moved from one buy to a run of sells, and from Tuesday each day’s sell zone sat lower than the day before. Monday’s second sell was planned at 4168.3–4172. Friday’s sell was planned at 4022.9–4027, about $145 lower.
The direction was not the whole story. Monday opened with a buy that went wrong and a public “I’m still down $26k” post before a sell that Mo reported as a 300+ pip recovery. From Tuesday to Friday the public sells all moved into profit, but they ended in different ways: one with a last target note and no posted close, two with the last entries out at breakeven, and one with stops moved to entry after TP1 and no later update. Stops were widened on Monday and again on Wednesday before protection was set.
This recap reads those decisions together. It does not add up a weekly profit, rank trades by screenshot totals or turn old zones into new instructions. To follow the next plan as it is posted, visit Gold Trader Mo, follow @GTMO, and message @GTMOBest about free gold-signal access and support. Check the current access terms directly with support.
What Drove Gold This Week#
Reuters tied the week’s slide to energy prices and interest rates. On Wednesday, gold edged higher after touching its lowest level since October 15, as US Treasury yields eased and investors waited for the Federal Reserve’s October 27–28 meeting. On Thursday, oil climbed to a five-month high after Houthi attacks in Saudi Arabia, inflation worries grew and gold fell to its lowest level since August 3. On Friday, gold slipped below $4,000 for the first time since mid-July. Reuters said bullion had fallen 4% on the week at that point, on track for its worst week since June.
The table keeps each reading with its own source and time. These are intraday spot observations in US dollars per troy ounce, not daily closes.
| Trading date | Observed spot gold | Source and time | What the source described |
|---|---|---|---|
| Monday, October 19 | $4,146.505 | TradingView / OANDA, 22:00 Vietnam time | Market open; intraday snapshot from the Daily report |
| Tuesday, October 20 | $4,125.500 | TradingView / OANDA, 21:01 Vietnam time | Market open; intraday snapshot from the Daily report |
| Wednesday, October 21 | $4,137.94 | Reuters, 18:12 GMT | Up 0.3% after the lowest level since October 15 earlier in the day |
| Thursday, October 22 | $4,041.39 | Reuters, 18:05 GMT | Down 2.4%, lowest since August 3, as oil rose |
| Friday, October 23 | $3,998.35 | Reuters, 15:20 GMT | Below $4,000; session low of $3,975.23 |
Sources: the October 19 and October 20 Daily reports, and Reuters’ Wednesday, Thursday and Friday reports.
The 4% weekly figure is Reuters’ statement at Friday’s observation time, not a return calculated from this table. The readings come from different sources at different hours, so this recap does not claim a weekly open, close, high or low. December gold-futures settlements are a different instrument and are not used as spot closes here. The market context helps explain why sells fit the week; it does not prove why Mo chose any single entry.
Weekly Performance Snapshot#
The useful comparison is how each public plan developed and how it ended, not how many update messages appeared.
| Session | What the public record supports | Important distinction |
|---|---|---|
| Monday, October 19 | Buy reported TP1 and TP2 twice, then was closed at a loss; first sell reported TP1 and TP2, then breakeven; second sell reported TP4 with 130+ pips and later “300+ pips” with all trades closed | The “$26k” drawdown and the recovery are Mo’s own statements; the second sell’s stop was widened to 4178 first |
| Tuesday, October 20 | One public sell reported TP2 with a breakeven call, then TP4 with 100+ pips | The last note was “TakeProfit 5 incoming”; no final close was posted |
| Wednesday, October 21 | One public sell took partial profits and reported TP1 and TP2; the last entries closed at breakeven | The stop was widened from 4127 to 4129.6 before breakeven was set |
| Thursday, October 22 | One public sell reported three of four targets, closing at 4087, 4085 and 4083 | TP4 at 4081 was not reached; the rest closed at entry |
| Friday, October 23 | One public sell returned to its entries, then reported TP1 twice before stops moved to entry | No later target or final close was posted |
That is seven fully specified public plans in five sessions. On Tuesday through Friday, Mo also reposted updates from an additional trade run in his members’ channel. Those reposts are kept separate here because their plans were not published in advance on @GTMO.
No weekly profit, win rate or account return is calculated. Repeated alerts, replies and screenshots from one plan are not separate trades. The galleries hold five trade screenshots and five member screenshots, one of each per day. They are a selection, not the full archive.
Best Trades and Recovery Moments#
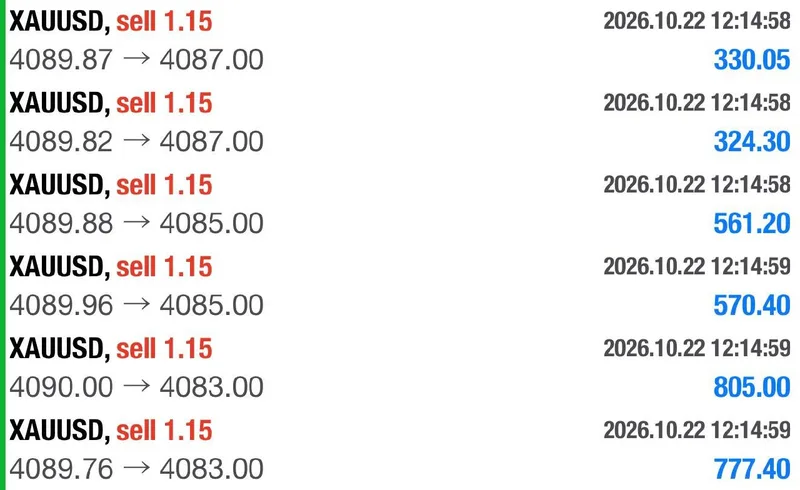
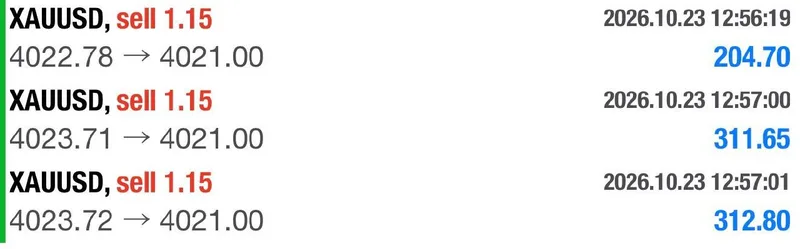
The cleanest finish came on Thursday. The public sell went straight to TP1, reached TP2 with a breakeven call and then TP3. Mo’s 17:54 recap showed six closed sells at 4087, 4085 and 4083, and TP4 was not reached. Three of four targets with the remainder out at entry is a complete, readable ending.
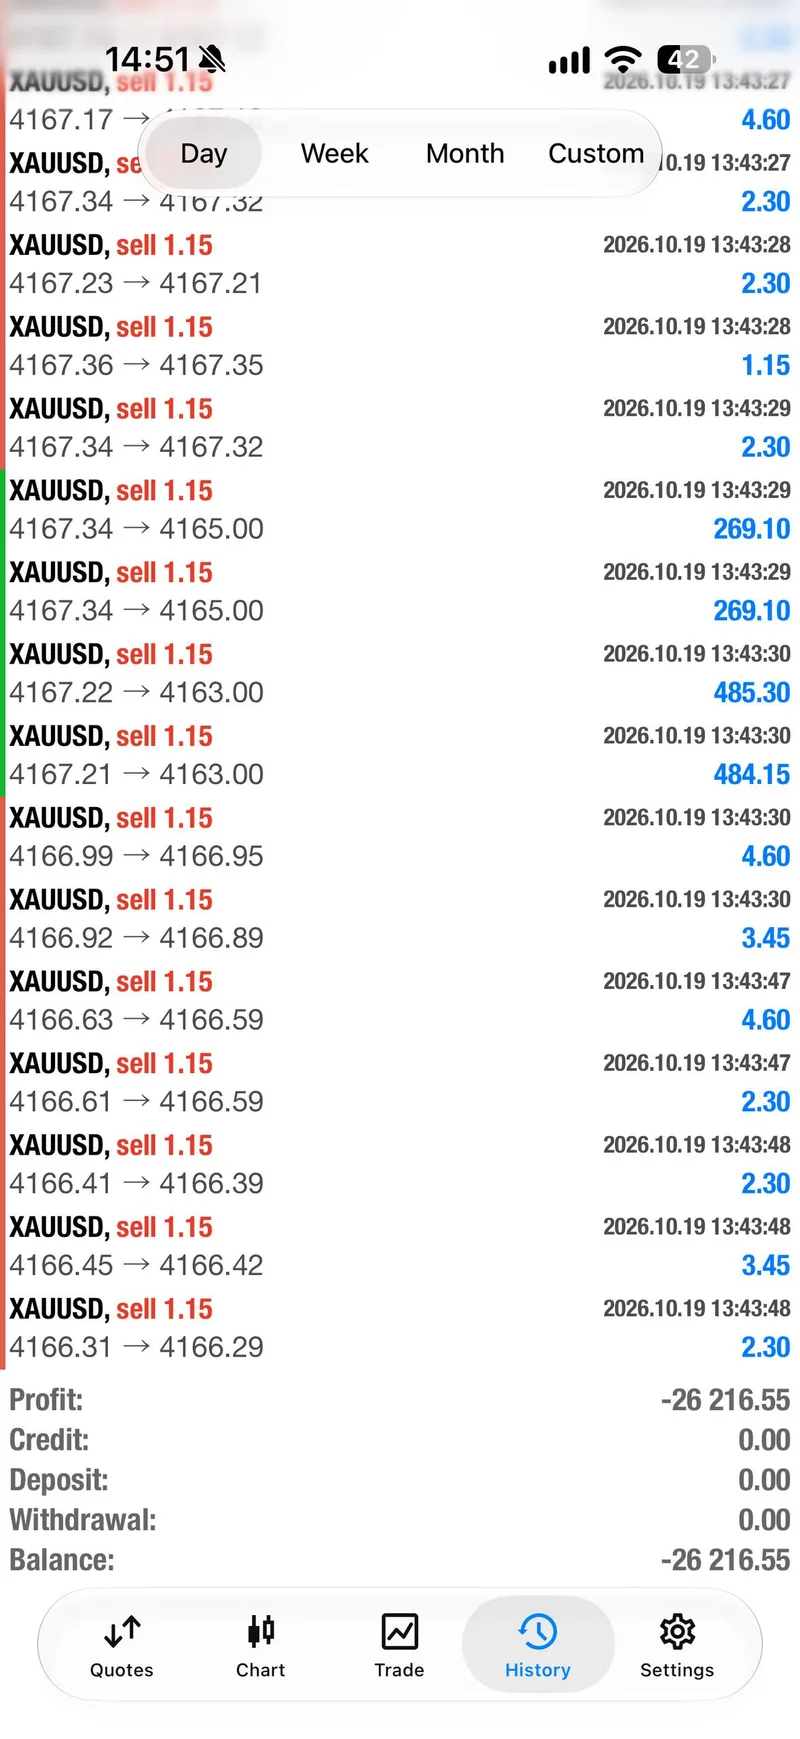
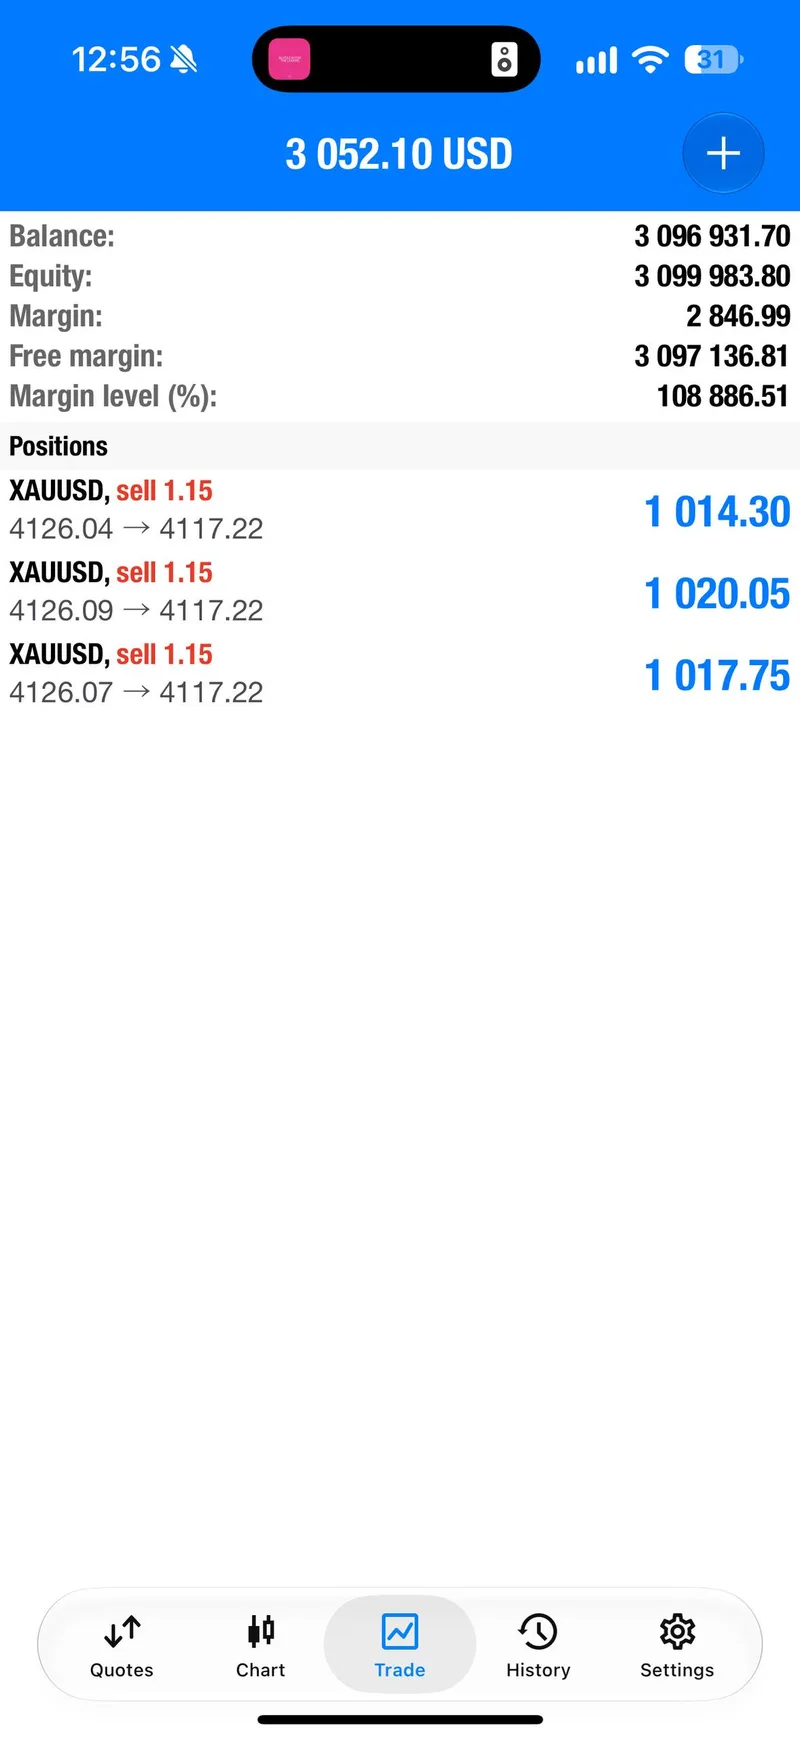
Monday was the most dramatic day, and it carried the most risk. Mo showed the loss in public rather than hiding it: “I’m still down $26k,” with a day-history screenshot showing a total of −26 216.55. His second sell then reported 100+ pips, TP4 with 130+ pips, and later “300+ PIPS TRADE CLOSED ALL NOW!!” That recovery is Mo’s own report. It came after the stop was widened to 4178, which raised the possible loss on the same position.
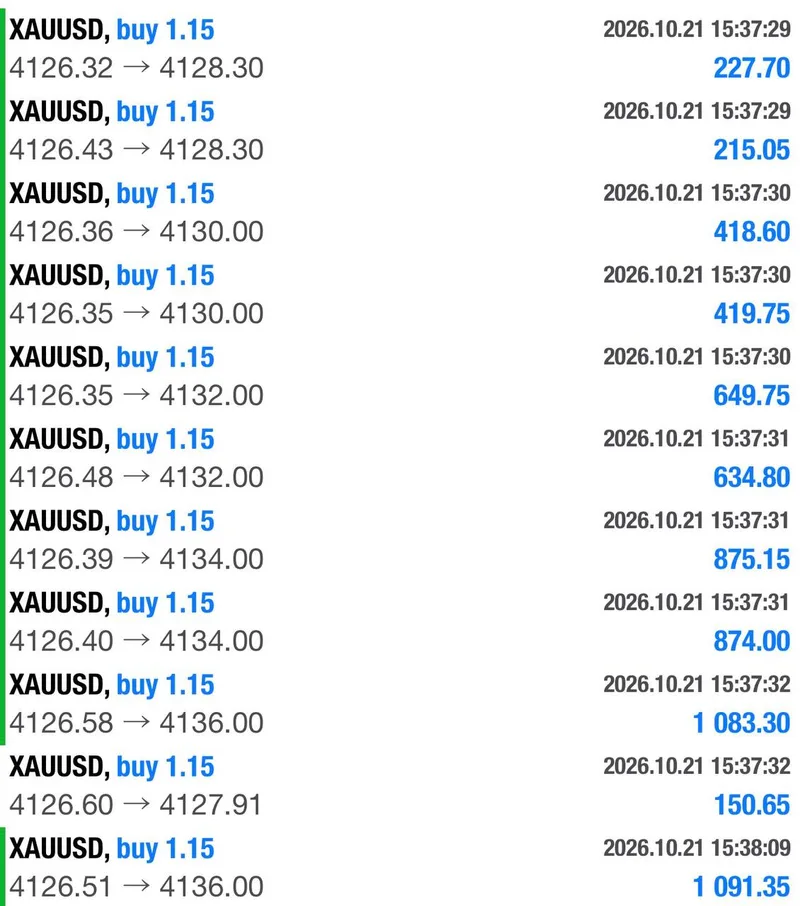
Wednesday’s members’ channel buy gave the week’s fullest target ladder. Mo’s 21:06 public recap said all five targets hit, and the history screenshot posted with it shows eleven buys closed in profit, ten of them at the five target prices from 4128.30 to 4136.00. That plan was not posted on @GTMO before entry, so it is shown here as shared after entry rather than as a public signal.
The gallery follows the week in order, from Monday’s drawdown to Friday’s TP1 closes. Each caption keeps the stage and limits of its screenshot.
Day-by-Day Trading Narrative#
Monday: a public loss, then a reported recovery. The October 19 report follows three public plans. The buy at 4174.7–4170 reported two quick targets twice, but its stop was moved lower, from 4166 to 4164, and the remaining buys were closed manually at 17:42 Vietnam time. The first sell reported TP1 and TP2 before breakeven. Mo then posted the $26k drawdown, explained the fake breakout and held a second sell after widening its stop from 4176 to 4178. That sell reported TP4 with 130+ pips, and at 22:03 he posted that everything was closed at 300+ pips.
Tuesday: fast targets, no posted close. The October 20 report shows one public sell at 4125.4–4129. Mo reported profit within a minute, TP2 with a breakeven call at 15:06 and TP4 with 100+ pips at 15:56. His last note was “TakeProfit 5 incoming” at 16:05, so TP4 is the last confirmed target. Reposts from a second sell showed it first in the red, at −3,551.20 USD, before it moved into floating profit.
Wednesday: a wider stop, then breakeven. Wednesday did not get its own Daily report, so the steps below come straight from the public channel. At 15:19 Vietnam time Mo posted the sell plan: 4118.9–4123, stop 4127, five targets from 4117 down to 4109. At 15:27 he warned that price was at the top of the zone. By 16:00 all entries were in profit, and at 16:01 he took partial profits, closing “worst entries first.” At 16:35 he moved the stop to 4129.6, above the original stop, saying the partial closes made that acceptable. More profit at TP1 and a breakeven call followed at 17:01–17:02, then TP2 at 17:14. At 17:38 he posted the finish: “Trade finished, breakeven hit on last entries.” That evening he reported a five-target members’ channel buy. In a 02:49 reply on October 22 to Wednesday’s “Good morning” post, he also claimed “$34,000+ CLOSED” in one day. That figure is his own unaudited statement and cannot be credited to the public sell alone.
Thursday: three of four, then entry. The October 22 report shows the public sell at 4089.2–4093 reaching TP1 within a minute, TP2 with breakeven at 16:19 and TP3 before the 17:54 recap. The last entries closed at breakeven. A reposted members’ channel sell then reported TP2 through TP5 but still had runners open at the last update.
Friday: a retest, TP1 and stops to entry. The October 23 report shows the public sell at 4022.9–4027 going into profit, then returning to its entries by 17:10. Mo reminded traders to use proper risk management inside the zone, reported TP1 at 17:23 with three sells closed at 4021.00, and posted TP1 again at 17:53 before moving stops to entry. Nothing later was posted for that trade. An earlier members’ channel sell had closed all its entries by 15:51.
What Worked, What Failed, and Why#
What worked was trading with the market’s direction and taking money early. All four public sells from Tuesday to Friday moved into profit and reported at least TP1, and each one got partial profits or a breakeven call along the way. In a week when gold dropped through $4,000, the record shows steady short-side plans rather than a single lucky call.
What did not work was the opening buy, and it cost money before the recovery. Monday’s buy reported early targets, then turned against the remaining entries. Mo closed those buys and showed the loss himself. The later 300+ pip recovery is his reported result, and it does not erase the earlier damage for anyone who held the buys or sized differently.
The wider stops deserve the most attention. On Monday the buy’s stop moved from 4166 to 4164, and the second sell’s stop moved from 4176 to 4178. On Wednesday the sell’s stop moved from 4127 to 4129.6 after partial profits. Each change added possible loss before protection arrived. Those trades later reported targets or breakeven, but a good result does not prove the extra risk was right. A follower should fix position size and maximum loss before entry, not let a widening stop decide them.
Breakeven protected traders, and it also capped trades. Breakeven calls on Tuesday, Wednesday, Thursday and Friday meant remaining entries could exit at entry instead of turning into losses. It also meant breakeven ended Wednesday’s trade after TP2 and Thursday’s after TP3. On Thursday, gold later traded below the unreached 4081 target, at $4,054.445 by 21:00 Vietnam time. Friday’s record stops at TP1 with stops at entry and no final update. That is a trade-off, not a failure: some profit was taken and the rest of the risk was removed.
Community Proof and Trader Confidence#
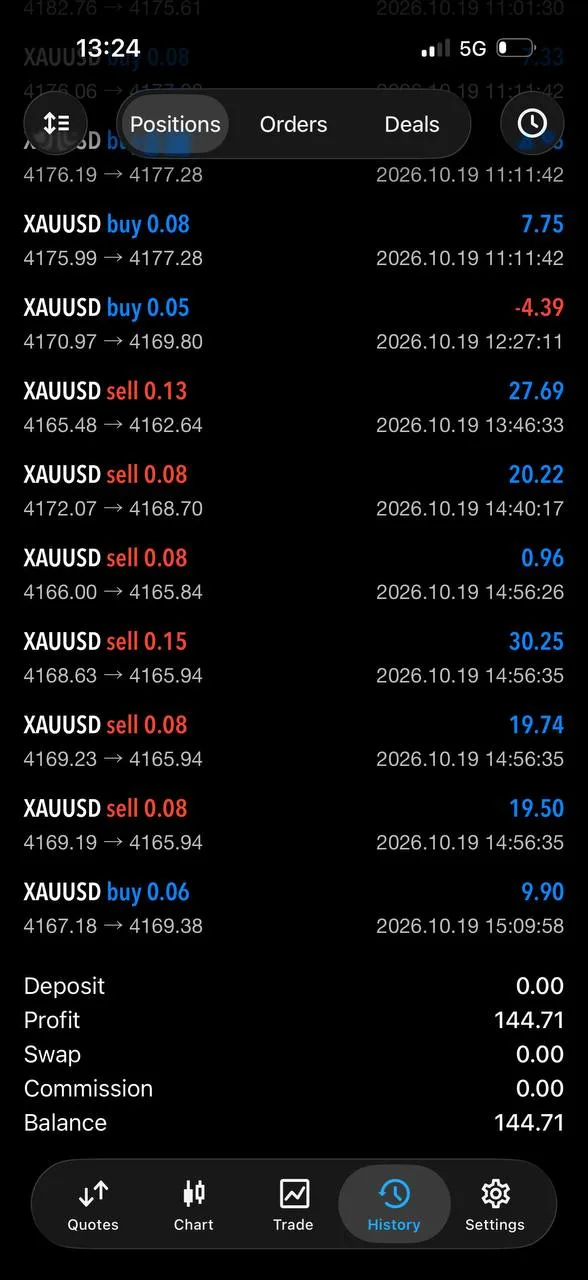

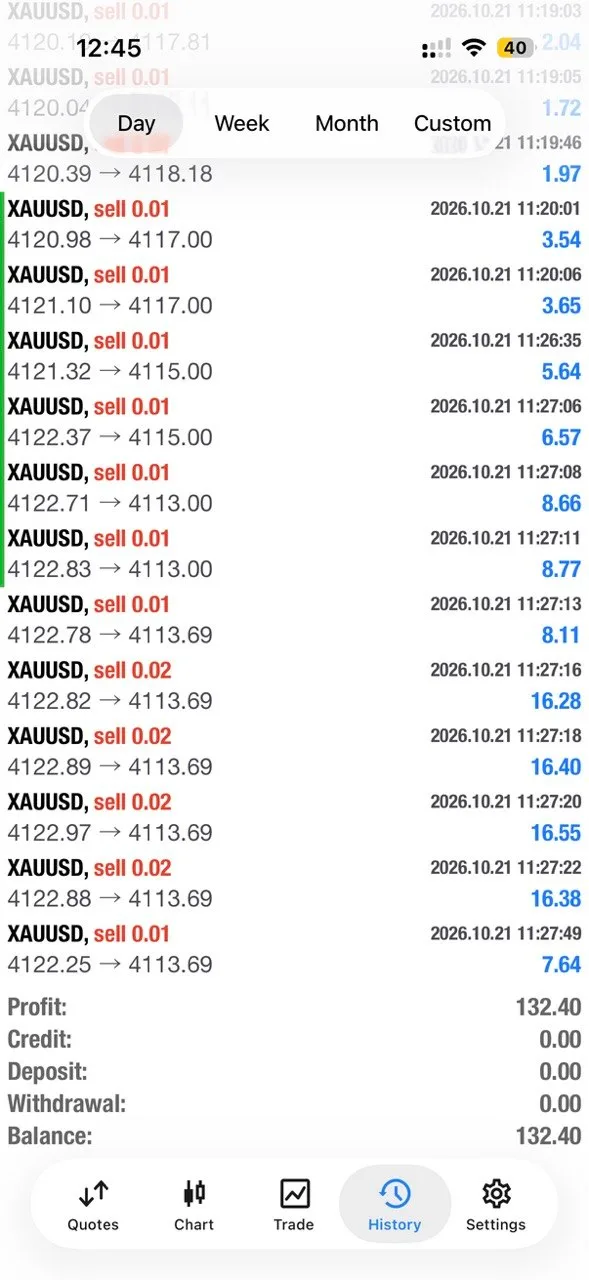
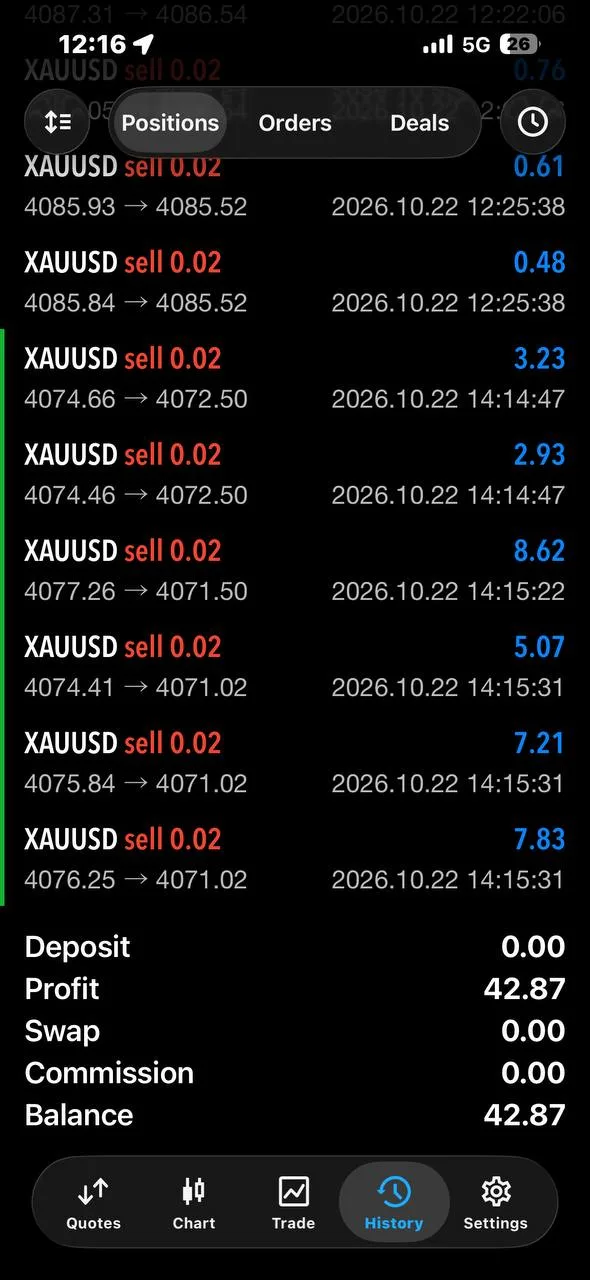
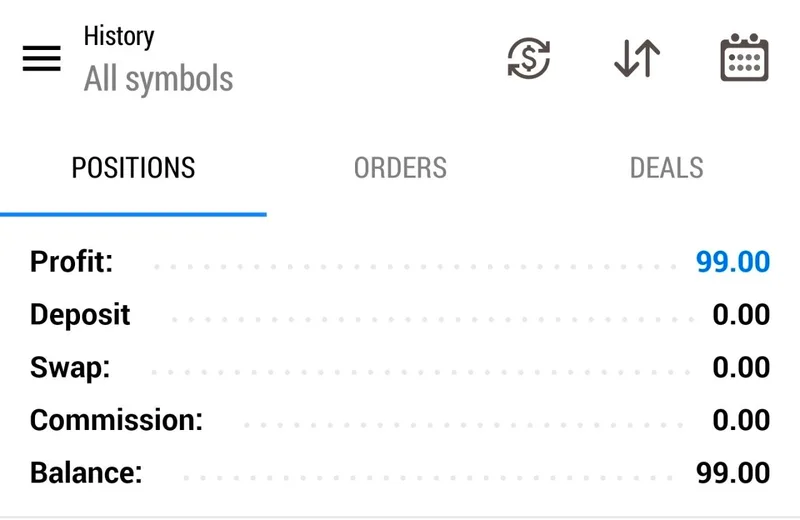
Members posted their own results throughout the week, and the screenshots show different choices. On Monday, Callum shared a history with a losing buy row next to his profits. On Wednesday, Patryk wrote “Today 130€” and shared small 0.01–0.02 lot sells closed between about 4118 and 4113.69. On Friday, CM wrote “Today I made my biggest profit!!” beside a history showing 99.00. These are small, personal results from members’ own screens, not copies of Mo’s.
The images keep their limits. Several show a profit figure without a visible currency or time period, and some members described more than one trade or trades of their own. None of these figures are converted into dollars or added together. They are individual public posts, not a survey of all followers or a promise of typical earnings.
The gallery helps readers compare members’ exits with Mo’s updates. It does not show that every member took the same entries, used the same size or reached the same result.
Key Levels and Scenarios for Next Week#
This week’s plan zones are history, not fresh support or resistance. Friday’s 4022.9–4027 sell zone explains Friday’s trade; it is not a Monday order. The levels the market itself put on the record are $4,000, which gold broke on Friday, and Reuters’ $3,975.23 session low.
If gold climbs back above $4,000, the question for a reader is whether a new buy plan defines its stop before entry and keeps it there. If the $3,975 area fails, the same standard applies to another sell: identify the risk first, then watch whether exposure is reduced or the stop is widened as the move develops. Either way, the Fed’s October 27–28 meeting and the PCE inflation report due October 29 can move gold quickly, so a plan made before those events needs its own invalidation.
For a forward view, read the October 26–30 Weekly Gold Forecast: $4,000 Meets the Fed. Compare it with this week’s October 19–23 forecast, last week’s October 12–16 summary and the weekly summaries archive. This recap’s job is the completed week’s record, not a price prediction.
FAQ#
Did gold finish the week below $4,000?#
Reuters reported spot gold at $3,998.35 at 15:20 GMT on Friday, below $4,000 for the first time since mid-July and down 4% on the week at that time. That is an intraday reading, not a final weekly close, so this recap does not state where the week ended.
Why is there no Daily report for October 21?#
Wednesday was a normal trading session, but no Daily report was published for it. This summary reads the day directly from the public @GTMO channel instead: one sell plan, partial profits, TP1 and TP2, a wider stop and a breakeven finish.
Did Mo report a profit for the whole week?#
No weekly total was posted, and none is calculated here. The figures in this recap are Mo’s statements for single days, such as Monday’s $26k drawdown and Wednesday’s $34,000+ claim, along with screenshot totals and pip counts. None of them are independently audited.
How can I follow the next public plan?#
Follow @GTMO and ask @GTMOBest about free access and support. Save the new plan and its updates, decide your own risk before entry, and do not trade from an old weekly recap.
Connect with Gold Trader Mo#
The reason to follow Gold Trader Mo is that the plan, the drawdown and the reported finish all appear in public, including on days like Monday. Read the linked Daily reports, compare the decisions, and message @GTMOBest for current free gold-signal access and support.
Risk disclaimer: This historical summary is educational commentary, not personalized financial advice or a live trading instruction. Gold and leveraged trading involve substantial risk, and capital can be lost. Past performance, channel-reported results and member feedback do not guarantee future returns. Use independent judgment, appropriate position sizing and loss limits.