
Weekly Gold Forecast Snapshot#
Gold’s first test for October 19–23 is not a new all-time high. It is whether buyers can turn $4,200 from a ceiling into support before Friday’s global business surveys put growth and inflation pressure back in focus. Until that happens, the more useful working range is $4,100–$4,200, with $4,073 as the next downside checkpoint.
Our starting assessment is 50% range/base, 30% bullish recovery and 20% bearish breakdown. These are GTMO editorial judgments, not statistically calibrated odds or promises. Each path below has an observable trigger and a point at which it stops making sense.
Prepared October 17 for the coming Monday–Friday window. Investing.com’s October 16 historical XAU/USD table records $4,165.50 per troy ounce; that is an indicative spot-market reference, not an exchange settlement or a live Monday quote. Its quote header differs slightly, so the table—not the header—is the reference used here. Historical price source.
Want help following the map without treating every price spike as a trade? Message @GTMOBest for free GTMO access and support. Access does not remove market risk.
The Main Drivers That Could Move Gold This Week#
Inflation leaves a difficult backdrop, even without another CPI release this week. The September US CPI report, released October 14, showed headline prices rising 0.6% month over month, seasonally adjusted, and 3.7% year over year, unadjusted. Core prices rose 0.3% over the month and 2.6% over the year. That makes a simple “inflation up, gold up” story too shallow: a stronger interest-rate response can work against a non-interest-bearing asset. The next test is how markets interpret fresh growth and survey price information, not a replay of last week’s CPI headline. BLS release.
Nominal yields remain a hurdle, not a guaranteed sell signal. FRED’s latest displayed 10-year constant-maturity Treasury yield was 5.10% for October 15, updated October 16. This is a dated nominal-yield observation, not Friday’s final yield or a measure of inflation-adjusted yields. A renewed rise alongside a firmer dollar would make a sustained gold breakout harder; easing pressure would give buyers a better chance. Neither relationship is automatic during a sharp flight to safety. FRED DGS10.
Friday’s flash PMIs are the clearest scheduled cross-market checkpoint in this map. The surveys offer an early view of October business activity. Read output, new orders and price pressures together, then watch whether Treasury yields and the dollar confirm the initial interpretation. A weak growth reading can reduce rate pressure, but it can also lift demand for dollar liquidity. The gold reaction matters more than a mechanical “good data/bad data” rule. S&P Global release calendar.
Do not put a Fed decision into the wrong week. The official FOMC calendar lists October 27–28, after this forecast window. This week can change positioning ahead of that meeting, but it does not contain the scheduled October rate decision. FXStreet also flags housing updates and initial jobless claims in its week-ahead context; the timed calendar below focuses on directly verified PMI releases rather than assigning unverified times to those secondary watchpoints. Federal Reserve calendar · FXStreet gold context.
Key Technical Levels and Decision Zones#
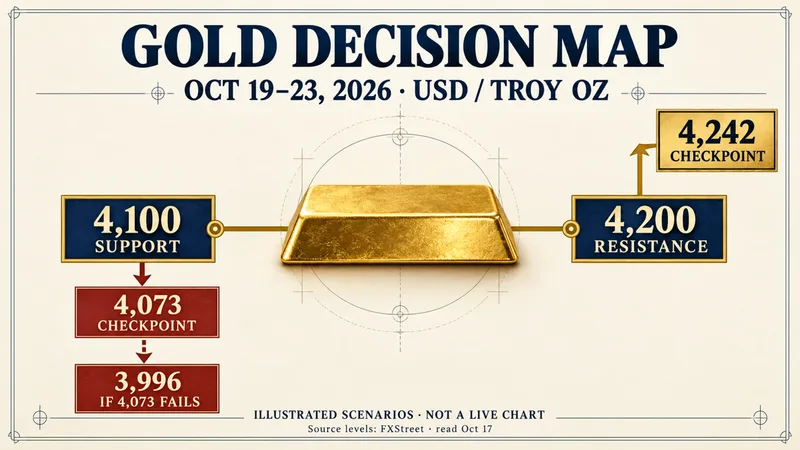
The decision map uses the $4,100–$4,200 range and reaction levels described in FXStreet’s Friday gold analysis, read October 17. These are approximate zones on an over-the-counter market: your broker’s candles and spreads can differ. They are not fresh order recommendations. Technical source.
| Zone, USD per troy ounce | Why it matters | What would change the read |
|---|---|---|
| $4,200 | First resistance and the top of the working range | A completed four-hour close above it, then a retest that holds, would support the bullish path |
| Around $4,242 | The source’s 100-day moving-average reference | An upside checkpoint after confirmation, not a promised destination; the moving average will change |
| $4,100 | First range support | A completed four-hour close below it followed by a failed recovery would strengthen the bearish path |
| Around $4,073 | The October 14 low highlighted by the source | The first lower checkpoint if $4,100 fails |
| Around $3,996 | A deeper historical reaction level cited by the source | Relevant only after a sustained break of $4,073; not the base-case destination |
The four-hour close and retest tests are our operational definitions of confirmation, not a claim that the source prescribed those rules. A wick through a level is not enough. A moving average is not a fixed wall, and a round number can be breached briefly without changing the week’s broader structure.
For context rather than a performance comparison, see the previous weekly gold forecast. The current levels and scenarios supersede that older week’s map; its targets should not be carried forward automatically.
Bullish, Base, and Bearish Scenarios#
Bullish scenario#
30% editorial probability — $4,200 becomes support. Trigger: a completed four-hour close above $4,200, followed by a retest that holds, preferably with easing Treasury-yield pressure and no renewed dollar surge. A brief release spike alone does not qualify.
Path: sustained acceptance above $4,200 puts the area around $4,242 in focus. Treat that as a checkpoint at which to reassess, not a minimum return or an assured target. If Friday’s survey response cannot hold the breakout, the apparent strength may have been only a temporary squeeze.
Invalidation: a completed four-hour close back below $4,200 followed by a failed attempt to reclaim it cancels this breakout setup and returns attention to the range. Do not wait for $4,100 to fail before admitting that a specific $4,200 breakout has failed.
Base scenario#
50% editorial probability — rotation, not a confirmed trend. Trigger: gold fails to sustain breaks outside $4,100–$4,200 while rate and dollar signals remain mixed. This is the default until one of the other confirmation sequences appears, not an instruction to buy and sell every touch of the range.
Path: uneven movement between the two boundaries, potentially including false breaks before the PMI releases. Near the middle, the room to either edge may be too small to justify the uncertainty. Waiting is a valid decision when the map offers no clear advantage.
Invalidation: either a confirmed hold above $4,200 or a confirmed loss of $4,100, using the four-hour close-and-retest rules above and below. The range view must change when price acceptance changes, even if a preferred macro story has not caught up.
Bearish scenario#
20% editorial probability — $4,100 gives way. Trigger: a completed four-hour close below $4,100 followed by a recovery attempt that fails to reclaim it. Renewed yield pressure and dollar strength would reinforce the move, although a price breakdown need not wait for every macro signal to align.
Path: $4,073 becomes the first downside checkpoint. Only a sustained break there opens the deeper area around $3,996. Do not turn the second checkpoint into a forecast of inevitable losses or assume a gap will offer an orderly entry.
Invalidation: a completed four-hour close back above $4,100, followed by a retest that holds, cancels this breakdown setup. That initially restores the range case; it does not by itself confirm the bullish $4,200 breakout.
The three probabilities sum to 100%. They describe the starting framework, not the chance of profiting from a trade. They can become obsolete after new information or a weekend gap.
Economic Calendar and Market Risks#

This is a focused catalyst calendar, not every release scheduled worldwide. Times below are taken from S&P Global’s UTC calendar and converted to Vietnam time, UTC+7. Check for schedule revisions before acting; consensus readings are not supplied here. Original calendar.
| Release | UTC date and time | Vietnam date and time | What to watch |
|---|---|---|---|
| Flash Australia PMI | Thu Oct 22, 22:00 | Fri Oct 23, 05:00 | First regional business-survey context |
| Flash Japan PMI | Fri Oct 23, 00:30 | Fri Oct 23, 07:30 | Asian activity and price-pressure clues |
| Flash Eurozone PMI | Fri Oct 23, 08:00 | Fri Oct 23, 15:00 | Growth outlook and potential currency spillovers |
| Flash UK PMI | Fri Oct 23, 08:30 | Fri Oct 23, 15:30 | A second European growth-and-prices check |
| Flash US PMI | Fri Oct 23, 13:45 | Fri Oct 23, 20:45 | The key late-week US activity test for this map |
The clustered releases create a sequencing risk: a move after the Asian or European surveys can reverse when the US numbers arrive. Watch the market’s ability to hold a level after the final major survey in the sequence, not just the first headline.
Unscheduled geopolitical developments can overwhelm the calendar and make gold and the dollar rise together. This is a general risk condition, not a claim that a particular new escalation has occurred. A weekend opening gap can also skip a planned level. Spreads and execution costs can widen near releases, and a protective order does not guarantee its intended fill price.
How To Think About Positioning This Week#
Monday and Tuesday: establish where the week actually opens relative to $4,100 and $4,200. Do not pretend Saturday’s reference is Monday’s live price. If gold opens outside the range, first decide whether the move is holding or reversing; the pre-week probability labels are not a reason to force it back into the original box.
Wednesday and Thursday: watch whether yield and dollar changes support any early breakout attempt. Keep housing and labor updates on the watchlist, but verify the live release schedule before making an event-timed decision. A quieter-looking day is not a risk-free day.
Friday: follow the PMI sequence through the US release at 20:45 Vietnam time. Reassess confirmation after the data, rather than treating a pre-release move as evidence that the result is already known. There is no obligation to take a position before the weekend.
The practical rule is to define the invalidation and maximum affordable loss before considering an entry. Position size, leverage and execution conditions matter more than whether an editorial scenario has the highest percentage. This forecast is a planning aid, not a substitute for an individual risk assessment.
FAQ#
Is $4,200 a guaranteed breakout target?#
No. It is the first resistance and confirmation threshold in this map. The bullish path requires acceptance above it and a holding retest; otherwise the range case remains more useful.
Is there a Federal Reserve rate decision during October 19–23?#
No scheduled decision is listed for that window in the official calendar. The October meeting is October 27–28. Markets can still reprice expectations beforehand.
Does the US flash PMI always move gold in one direction?#
No. Growth, prices, yields, the dollar and safe-haven demand can pull in different directions. A weaker survey does not guarantee a higher gold price.
Connect with Gold Trader Mo#
Use this map alongside the October 15 daily report and October 16 daily report for recent session context, not as evidence of future returns. Gold Trader Mo publishes the scenario framework so readers can see what would change the view, not just a directional headline.
For free access and help following GTMO’s updates, contact @GTMOBest. Ask about the current access arrangements; no profit, execution result or personal suitability is guaranteed.
Disclaimer#
This weekly forecast is educational market commentary, not personalized financial advice or a recommendation to place a trade. Trading involves risk. Trading gold and leveraged products involves substantial risk, including loss of capital. Historical prices and past performance do not guarantee future results. Scenarios can fail, and no probability or target here guarantees a profitable outcome.