title: "Gold Trading Daily Report — February 27, 2026: Both Signals WIN, $35,000+ Profit, New ATH $5,404!" slug: "gold-daily-report-february-27-2026" excerpt: "Gold surged +1.20% to $5,250.20, touching ATH $5,404.51. Both BUY signals won with 100% accuracy — $35,000+ profit. Signal 1 caught the $5,180 bounce, Signal 2 swept ALL TakeProfits for 400+ pips." type: "daily-report" status: "published" category_id: 2 author_id: 1 tags:
- "XAUUSD"
- "Gold Trading"
- "Daily Report"
- "Trading Signals"
- "February 2026"
Market Snapshot — February 27, 2026#
Gold closed out Friday with strong bullish momentum as macro conditions and intraday execution aligned in favor of buyers. XAUUSD pushed higher into the U.S. close while the dollar stayed soft and real yields drifted lower, a classic combination that supports precious metals. If you missed the setup progression into today’s moves, review yesterday's report for context before this continuation session. Across the Gold Trader Mo ecosystem, traders navigated a volatile but opportunity-rich session with disciplined risk management, especially during repeated retests around the London morning range.
Market Dashboard#
| Metric | Value | Change | Trend |
|---|---|---|---|
| XAUUSD | $5,250.20 | +$63.20 (+1.20%) | ↑ Bullish |
| DXY | 97.64 | -0.06 pts (-0.06%) | ↓ Bearish |
| VIX | 19.86 | +1.23 (+6.60%) | ↑ Rising |
| 10Y Yield | 3.95% | -6 bps | ↓ Falling |
| 10Y TIPS Real | 1.70% | -3 bps | ↓ Falling |
| WTI Crude | $66.18 | +$0.84 (+1.31%) | ↑ |
| Market Regime | RISK-OFF | VIX up, yields falling | Safe-haven bid |
| Gold-DXY | INVERSE | Gold +1.20%, DXY -0.06% | Classic inverse |
| Session Range | H: $5,256.90 / L: $5,166.00 |
The key message from this dashboard is straightforward: gold outperformed despite a mixed risk backdrop, and the underlying macro tape still favors dips being bought while yields remain contained.
Macro Drivers Today#
1. Fed Rate-Cut Expectations + Falling Real Yields — 🟢 Bullish | Impact: HIGH#
The U.S. rates complex remained supportive for gold, with the 10-year Treasury yield breaking below the 4.00% threshold and closing near 3.95%. More importantly for gold valuation, the 10-year real yield eased to around 1.70%, extending a decline of roughly 24 bps since early February. Lower real yields reduce the opportunity cost of holding non-yielding assets, and this effect was visible in Friday’s intraday recovery from lower levels.
Market pricing into the next FOMC meeting (March 17–18) still leans toward a hold (about 82%) with a non-trivial cut tail (about 18%). That combination keeps policy uncertainty elevated but generally asymmetric for gold: if incoming data softens, cut expectations can reprice quickly, adding upside pressure to XAUUSD.
2. Geopolitical Risk + Trade Tension Overhang — 🟢 Bullish | Impact: HIGH#
Safe-haven demand stayed firm as geopolitical flashpoints remained unresolved. Ongoing Middle East tensions, the Ukraine-Russia stalemate, and policy uncertainty around U.S. trade/tariff direction all contributed to defensive positioning into month-end. Gold’s $63 gain on the day is consistent with this risk-premium dynamic.
The important nuance is that these flows were not purely panic-driven. They appeared persistent and allocation-based, especially when paired with ETF inflows and resilient positioning data. In practical terms, that means gold can hold a bid even when intraday pullbacks look aggressive, provided macro risk does not materially de-escalate.
3. Technical Momentum + Month-End Positioning — 🟢 Bullish | Impact: MEDIUM#
February performance remained a major tailwind, with gold up about 6.7% for the month and moving averages still stacked in a constructive structure. This type of trend persistence often attracts systematic and discretionary follow-through buying, particularly around key session closes.
Friday’s action reflected that behavior: deep pullbacks were repeatedly defended, and trend continuation resumed once liquidity returned. Momentum indicators were not stretched into extreme overbought territory, leaving room for another upside leg if resistance breaks cleanly.
Technical Outlook#
From a structure perspective, gold remains in an intermediate bullish trend, but traders should respect volatility around pivot zones after a strong weekly move. The market has enough momentum to challenge upper resistance, yet intraday swings can be sharp when liquidity is thin.
| Level | Price | Significance |
|---|---|---|
| Key Resistance | $5,270.81 | R2 pivot, upside expansion trigger |
| Immediate Resistance | $5,237.03 | R1 pivot, now a confirmation zone |
| Current Price | $5,250.20 | Above immediate resistance |
| Immediate Support | $5,146.97 | S1 pivot, first downside defense |
| Key Support | $5,113.19 | S2 pivot, structure-critical |
| All-Time High | $5,404.51 | January 2026 reference extreme |
Moving Averages (bullish stack): 20 EMA near $5,019, 50 SMA near $4,798, 100 SMA near $4,473, and 200 SMA near $3,970. Price remains above all major trend filters, which supports a buy-the-dip bias while this hierarchy holds.
Momentum: RSI is in a neutral-to-positive zone (roughly 51–60), indicating trend support without obvious exhaustion. MACD remains on a buy profile with the MACD line above signal, consistent with continuation risk to the upside.
Scenario Matrix#
| Scenario | Probability | Trigger | Target |
|---|---|---|---|
| 🟢 BULL | 50% | Break above $5,237 and hold acceptance | $5,270 → $5,349 |
| ⚪ BASE | 30% | Rotation inside $5,147–$5,237 | Mean around ~$5,200 |
| 🔴 BEAR | 20% | Sustained break below $5,147 | $5,113 → $5,046 |
For active traders, the tactical playbook is unchanged: respect confirmed breaks at the edges of the range, reduce size inside chop, and avoid forcing entries mid-box when volatility spikes without direction.
Trading Signals — February 27 Performance#
Friday delivered two successful buy-side outcomes across the GTMO ecosystem: one public signal shared to Free + members channels, and one members-only continuation setup later in the session. The public setup emphasized discipline through repeated retests and break-even management, while the members desk captured the cleaner momentum extension.
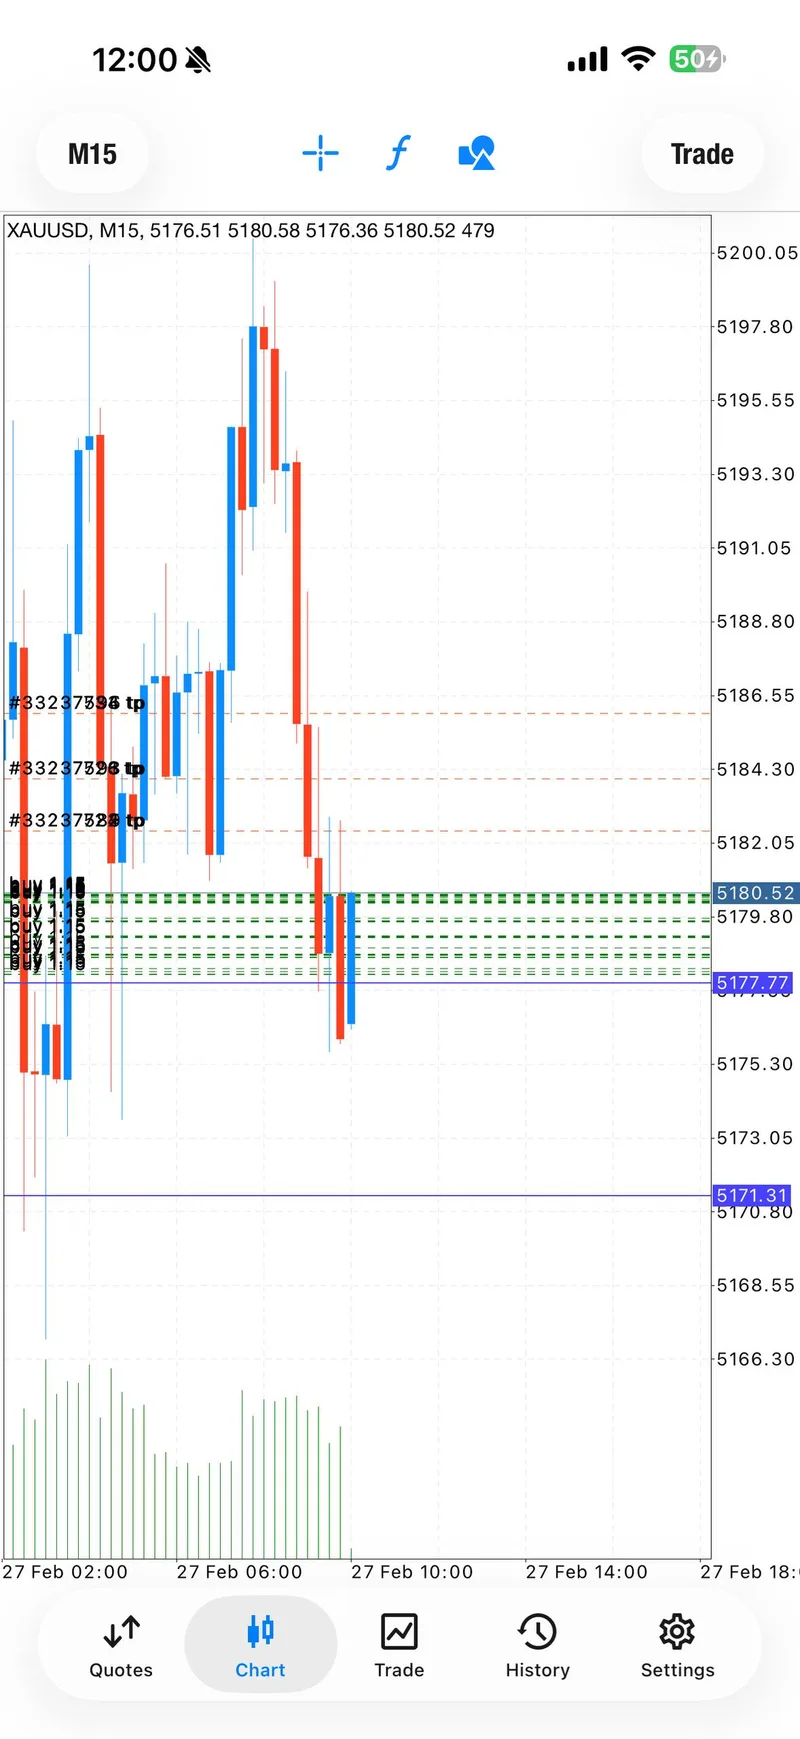
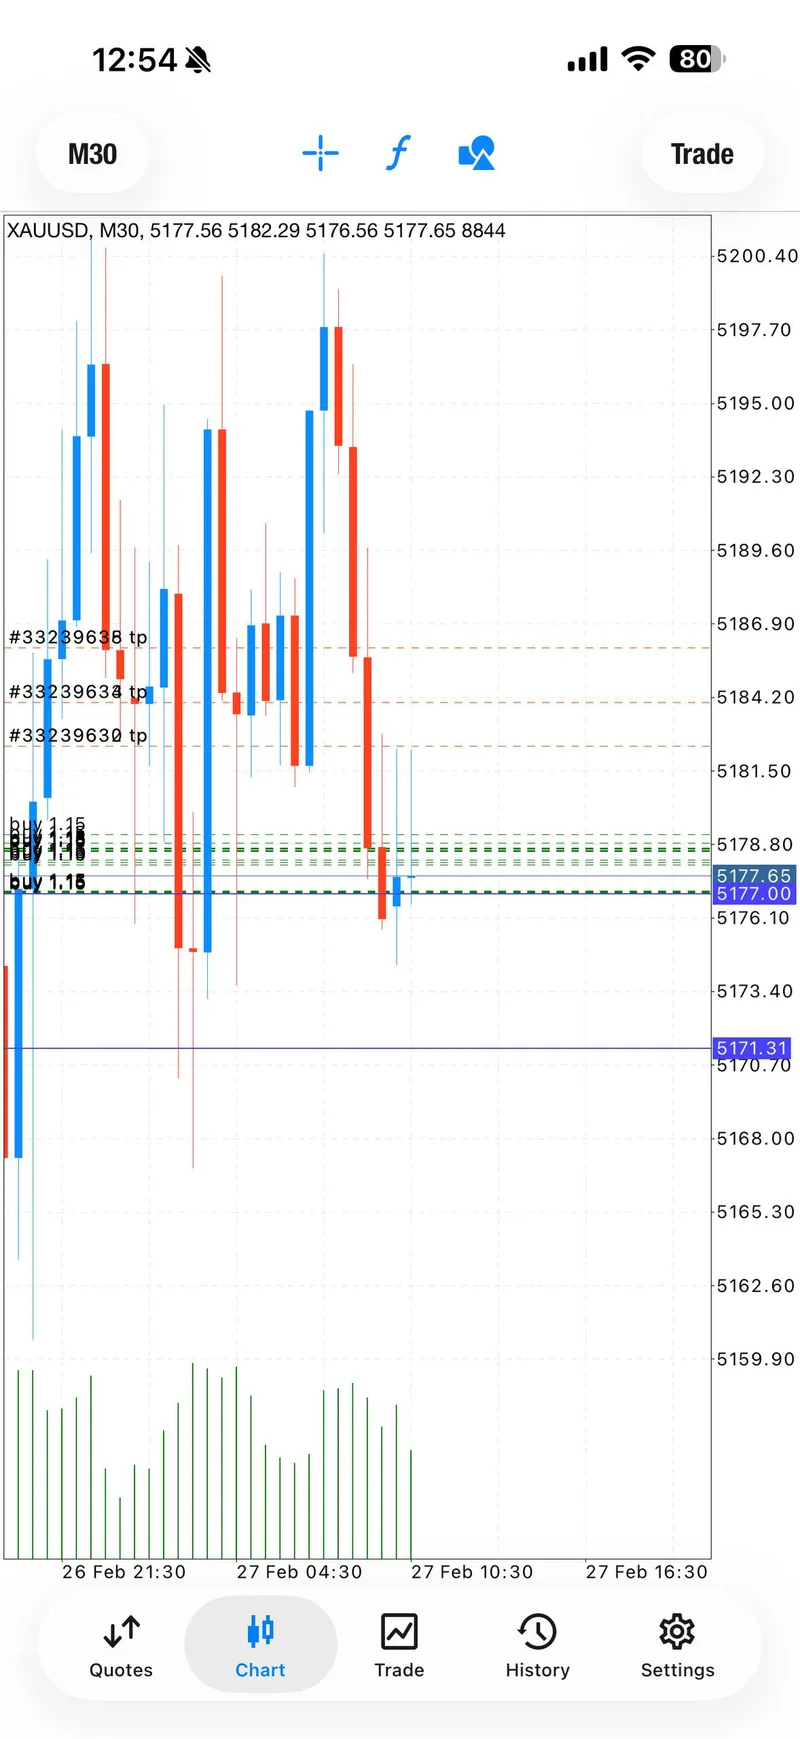
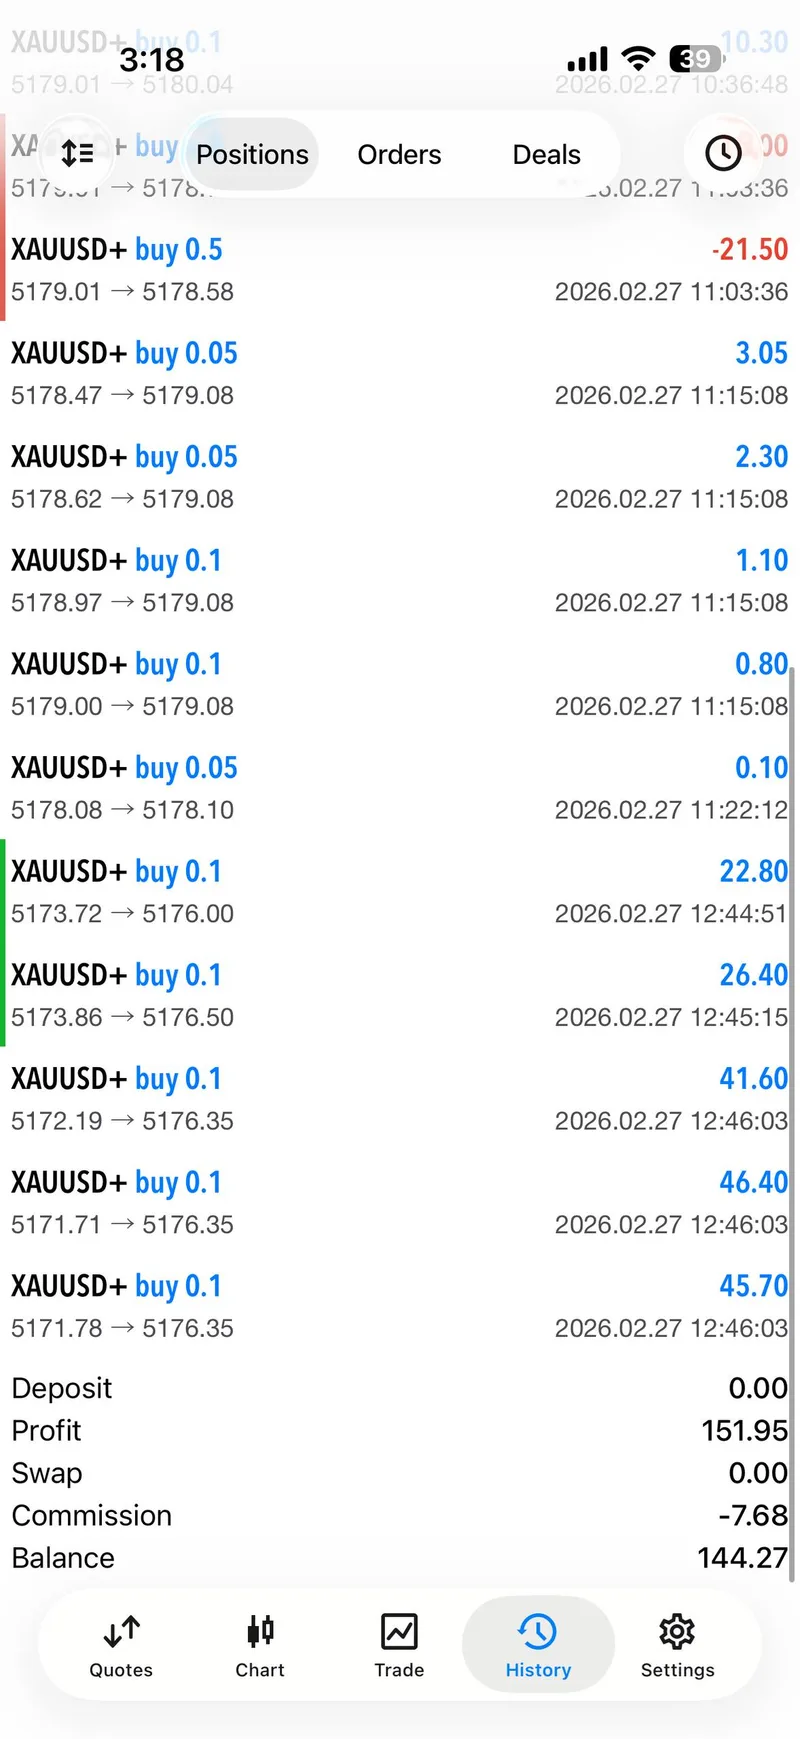
Signal 1: BUY XAUUSD @ London Session Retest (Public: Free + Members)#
- Entry Zone: $5,180.4 – $5,177
- Take Profits: TP1 $5,182.4 ✅ | TP2 $5,184 (runner target) | TP3 $5,186 (runner target)
- Stop Loss: $5,172
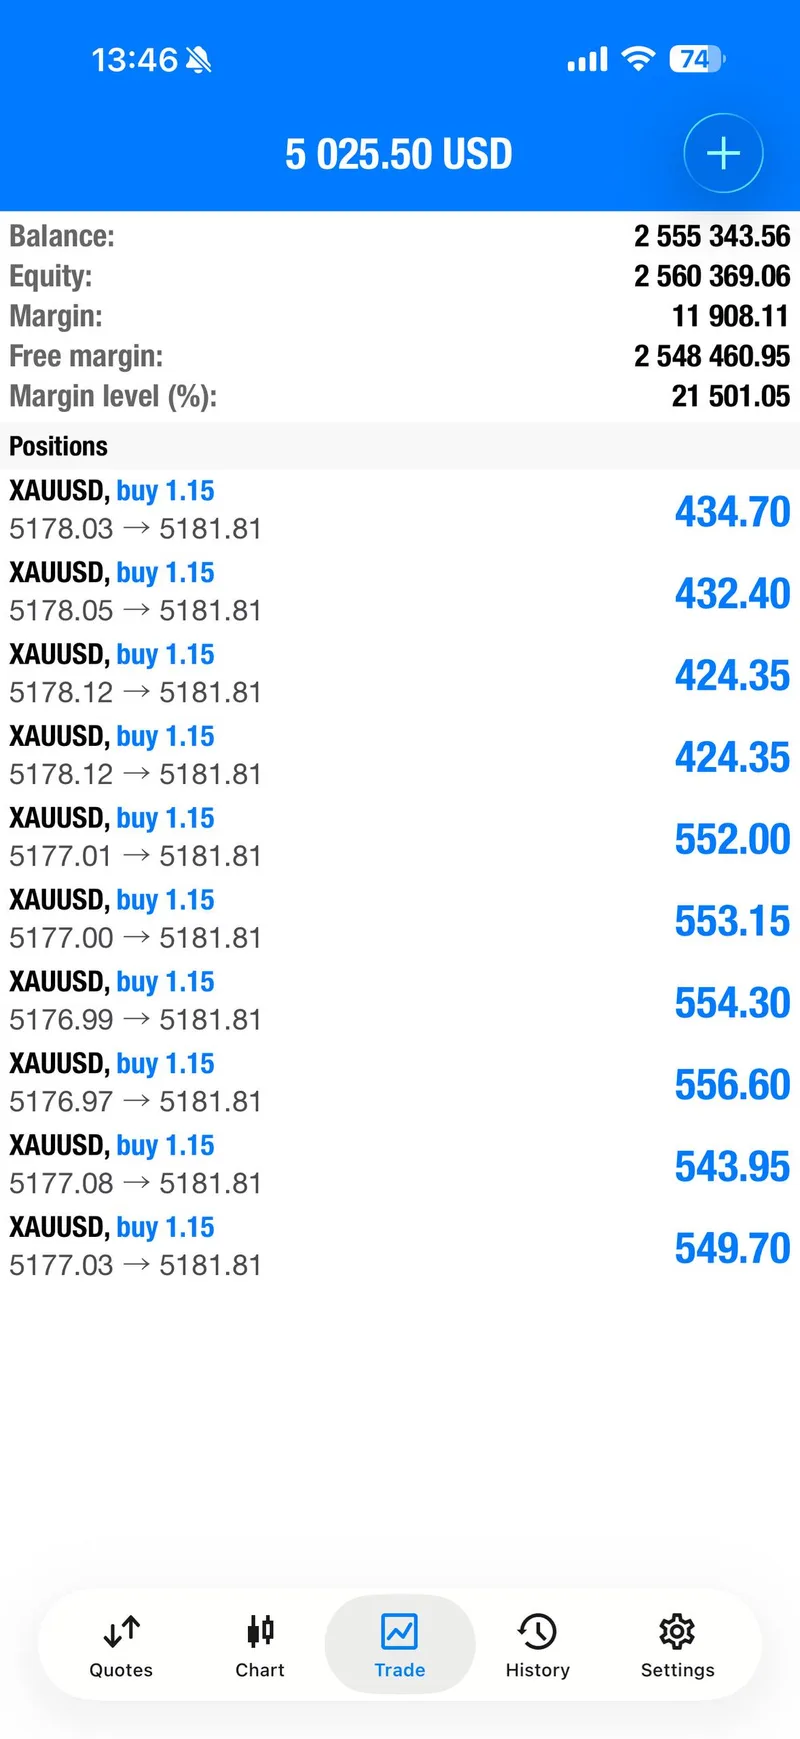
- Result: TP1 hit ✅, remainder protected at breakeven; trader update reported +$12,000 closed
Execution timeline (UTC):
- 07:57: Signal posted.
- 08:01 to 08:03: Zone filled, immediate push toward TP1 with quick risk reduction guidance.
- 08:26 onward: Price rotated back into the entry region; risk management reminders repeated during volatile retests.
- 09:45: TP1 check confirmed and breakeven set.
- 09:48: Breakeven tagged on remaining exposure.
- 09:51: Desk update reported the trade day up significantly and flat position.
This was a textbook example of how to survive noisy structure: take partials at first objective, de-risk quickly, and refuse emotional overtrading when price repeatedly teases a level before commitment.
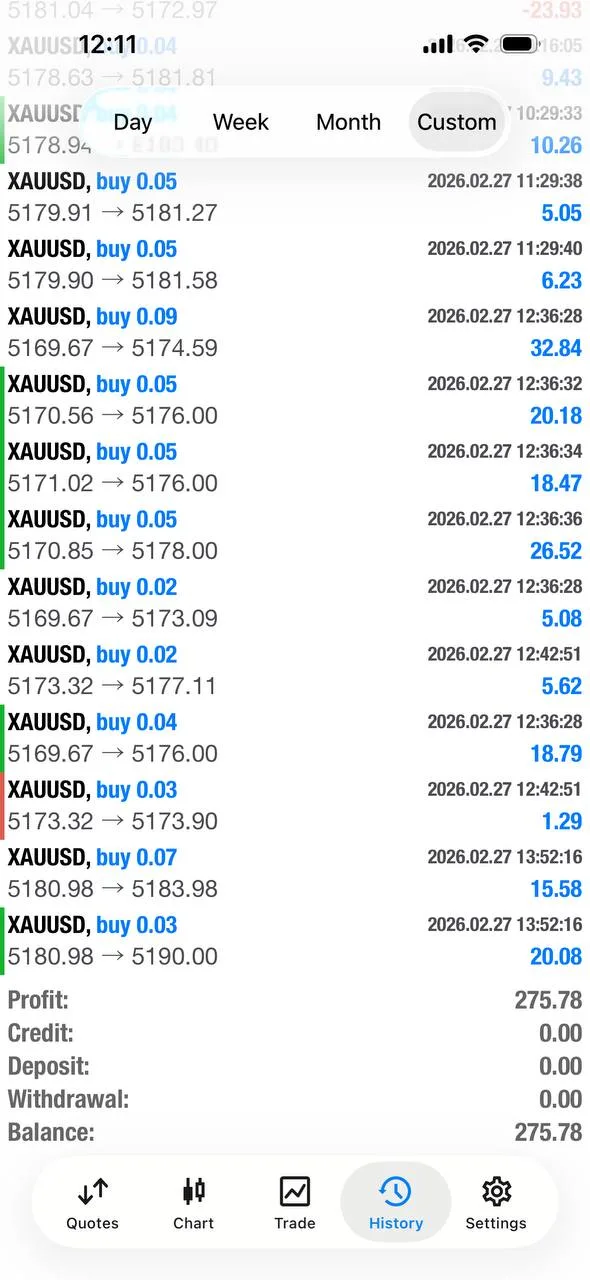
Signal 2: Members-Only XAUUSD Buy Setup#
- Access: Members channel only
- Result: All take-profit objectives hit ✅✅✅
- Performance: 400+ pips captured on the move
A second buy setup was issued to members channel participants and delivered full target completion. Publicly, the key takeaway is process consistency: first setup managed with strict risk discipline, second setup monetized continuation momentum.
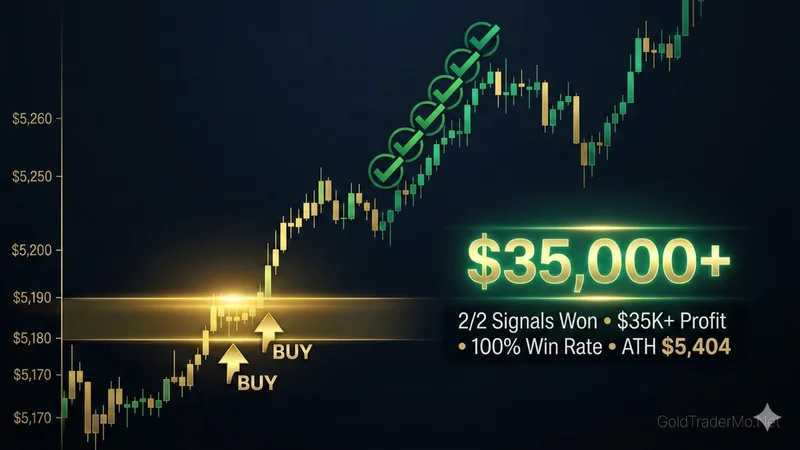
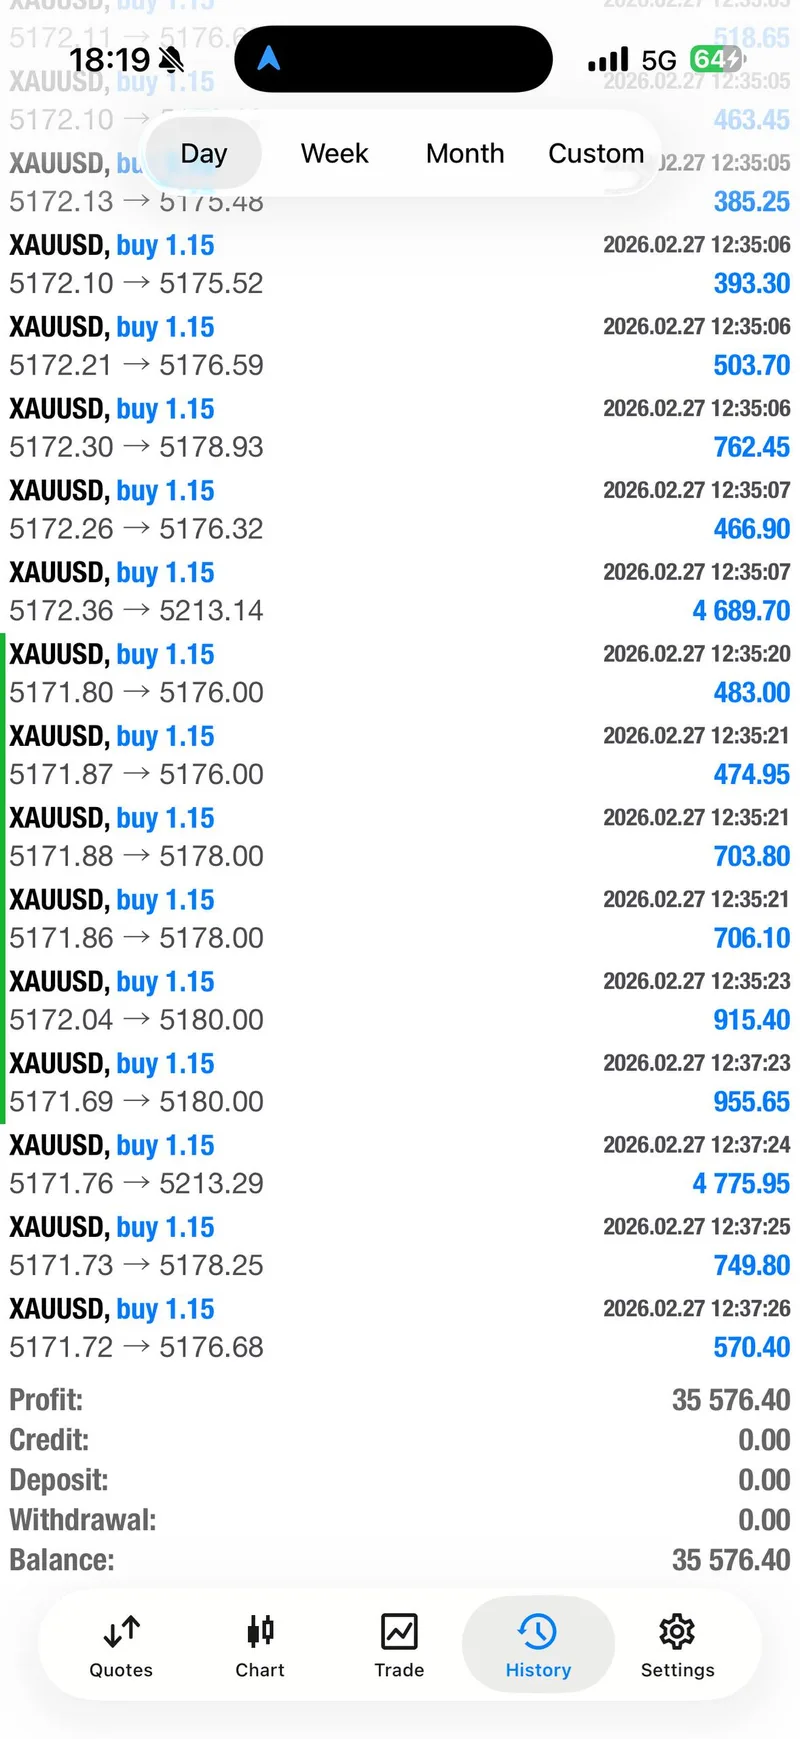
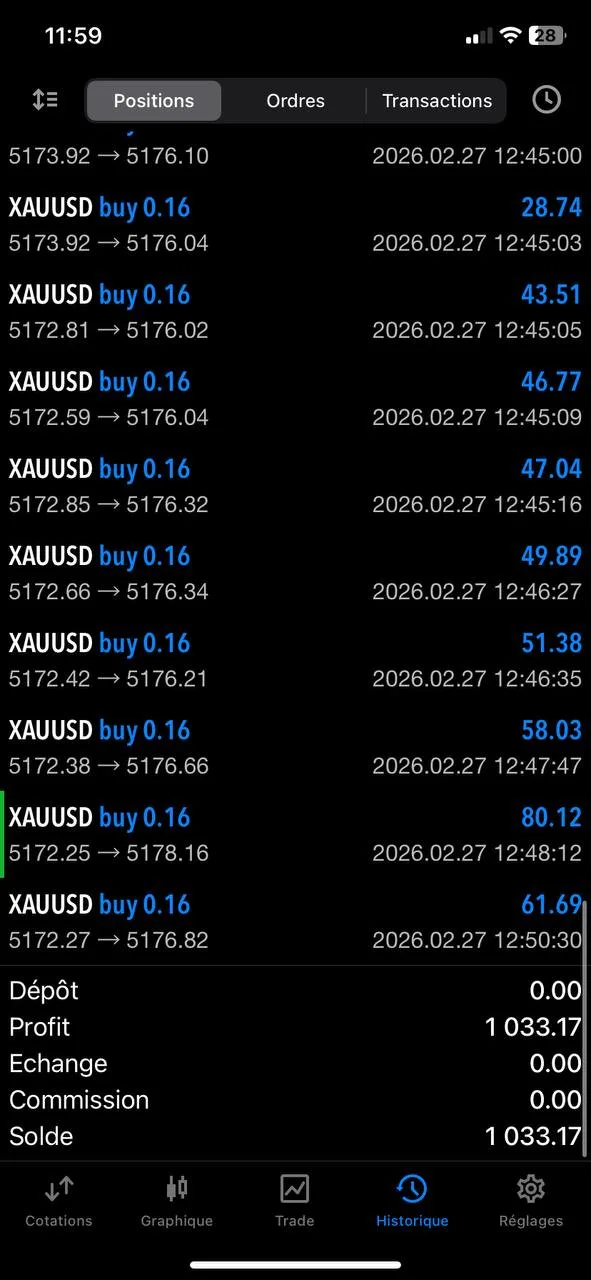
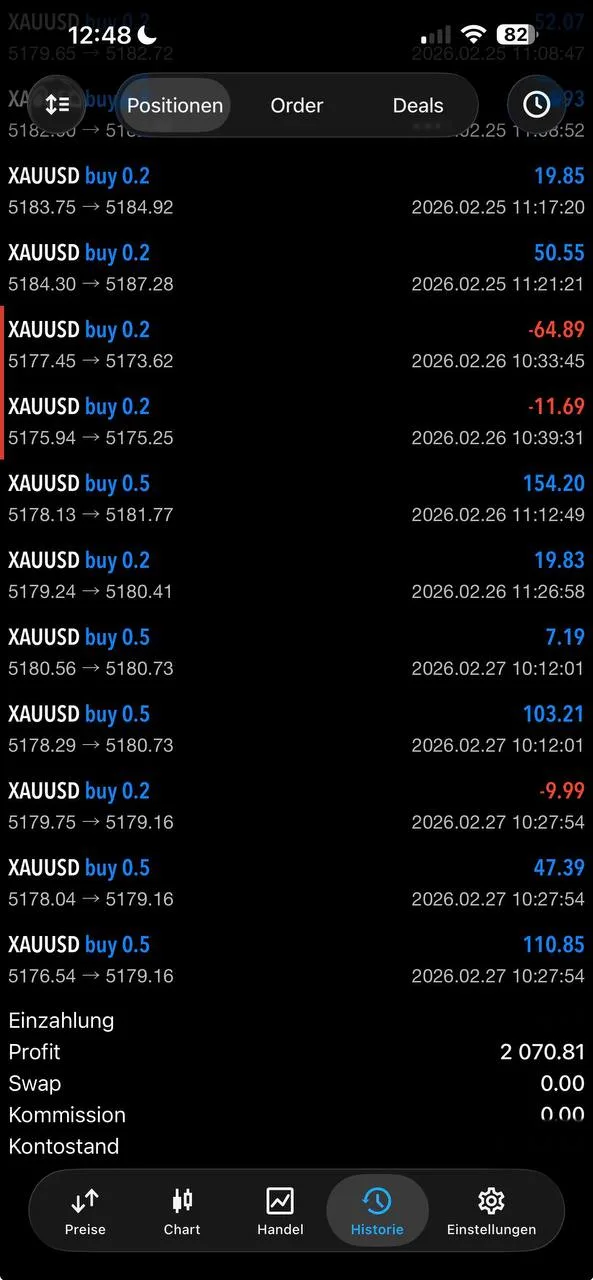
Daily Summary: 2 buy-side ideas across channels, public signal completed with TP1 + BE management, members-only signal hit all targets, and the desk closed the day at $35,000+ total realized profit.
For traders building repeatable intraday execution, this session also reinforces the same framework covered in our gold scalping strategy guide.
Signal Performance Breakdown#
Friday’s signal quality came from context alignment rather than prediction alone. The opening public setup leaned into macro support (falling yields, soft dollar, safe-haven bid) while using a defined intraday zone for controlled risk. Even when gold chopped aggressively and repeatedly tested trader conviction, the process stayed rules-based: partial at TP1, stop adjustment, and no unnecessary exposure after conditions changed.
The most important lesson is expectancy protection. A day with multiple fake pushes can still finish strongly if worst entries are managed early and breakeven is treated as a strategic outcome, not a failure. That mindset preserved capital and psychological bandwidth for the later momentum leg captured in the members stream.
Gold Positioning & Flows#
CFTC COT Positioning#
Latest CFTC data shows net speculative positioning near 212,808 contracts, maintaining a clearly bullish bias despite a small week-over-week reduction of about 1,700 contracts. That small trim does not change the broader story: speculative participation remains elevated, and pullbacks continue to attract positioning rather than trigger wholesale liquidation.
ETF Demand and Institutional Flow#
Gold ETF flow direction remains inflow-positive. January 2026 recorded approximately +120 tonnes, while total gold ETF AUM reached roughly $669 billion with holdings near 4,145 tonnes (record levels). Persistent institutional accumulation acts as a structural cushion during intraday volatility and supports the medium-term bullish thesis.
Combined, COT + ETF data suggest that the market is not merely short-covering higher; it is still being supported by real allocation demand.
If you're new to our entry model, risk rules, and session timing logic, see how our signals work for the full methodology.
Community Results#
Friday’s community feedback reflected both profitability and progression in execution discipline. Some members posted strong one-day gains, others highlighted breakeven-heavy sessions with net positive outcomes, and many emphasized weekly/monthly consistency over single-trade excitement. That mix is exactly what sustainable trading development looks like: controlled risk, repeatable process, and measurable growth in confidence.
Member Testimonials#
"+1000€ today my friend, & +4300 this week! WHAT A WEEK thank u bro 👊🏾🙏🏽🚀" — Pierre Pierre
"Weird trading day, so I have a lot of BE, but 156$ + 2 running..😉 Thank you Mo.💪🏻👑" — Thomas Maximus
"Mo ich wollte mich vom ganzen Herzen bei dir bedanken du veränderst Leben da drußen von tausenden Menschen ins positive" — AR
"280$ brother. Thanks for a great week" — Capo Bogdani888
"You made me almost 1k this month🙏🍀 I will jump out and enjoy my weekend. Bless you!🙏" — Jan Tajnik
"Hi Mo, just wanted to share this with you after my first week in the school. Thanks for the profits and the learning this week and onto bigger and better things next week!" — Fionntan Tennyson
"Thank you. From the bottom of my heart❤️!!! 2k in one month. That's almost a Salary. I'm learning a lot from you." — Seba Crush
"I just want to say you are truly the real G.O.A.T. I'm grateful for the guidance and support every single day. These daily and weekly profits mean a lot to me... May Allah continue to bless you with success, happiness, and barakah in everything you do. Ramadan Kareem 🌙✨." — Izze
"What a week. Thanks so much boss" — Rob
"I just can't keep quiet on this... my words are not enough to describe how good you been to me all this while I trade with you. I really appreciate brother 🙏🏾" — Prosper
Event Risk — Next 48 Hours#
Although Friday’s directional move was bullish, traders should avoid carrying momentum assumptions blindly into the next data window. Macro-sensitive assets can reprice quickly when inflation and growth signals diverge.
| Date/Time (UTC) | Event | Previous | Forecast | Gold Impact |
|---|---|---|---|---|
| Feb 27, 18:30 | PPI MoM | 0.4% | 0.3% | MEDIUM |
| Feb 27, 18:30 | PPI YoY | 3.2% | 2.9% | MEDIUM |
| Mar 02 | ISM Manufacturing PMI | 52.6 | 51.3 | LOW-MEDIUM |
| Mar 04 | ADP Employment | 22K | 19K | MEDIUM |
Central Bank Watch (context): Fed remains at 3.50–3.75% after January hold, with 82% hold and 18% cut odds for March. ECB and BOE both carry easing bias signals. Broad global liquidity tone is gradually shifting toward easing, which is generally supportive for gold over medium horizons.
Risk note: A softer-than-expected inflation/growth mix can reinforce gold strength through yields and USD, while surprise upside inflation without growth weakness could trigger short-term two-way volatility before trend clarity returns.
FAQ#
1) Why did the public trade close part at TP1 and move to breakeven instead of holding for full extension?#
Because market structure was noisy and repeatedly re-tested the entry region. In that environment, locking partial profit at first objective and protecting the remainder is a high-quality decision. The goal is not to predict every final tick; it is to preserve positive expectancy across many sessions. On this setup, that approach converted volatility into a controlled win rather than allowing a good trade to become emotional exposure.
2) Does a rising VIX automatically mean gold must go up?#
Not automatically, but in this session it aligned with other supportive inputs: lower nominal yields, lower real yields, and a softer dollar. Gold reacts to the full macro mix, not one variable in isolation. When multiple drivers point in the same direction, conviction can increase; when they diverge, position sizing should usually decrease.
3) What should traders focus on next week after a strong Friday close?#
Three priorities: (1) whether price can hold above recently reclaimed resistance, (2) how yields and DXY respond to fresh data, and (3) execution discipline inside volatile ranges. If momentum continues, breakout continuation setups become valid. If price rotates back inside the base scenario range, traders should avoid overtrading and wait for cleaner confirmation at key levels. For a broader process recap, pair this with our recent reports to compare evolving market structure day by day.
Connect with Gold Trader Mo#
- 🆓 Free Signals: GTMO Trades
- 💬 Support: @gtmobest
- 📺 YouTube: GTMOFX
- 📸 Instagram: mojirjees
- 🌐 Website: Gold Trader Mo
- 📚 More Reports: Daily Reports Archive
Risk Disclaimer: Trading XAUUSD involves substantial risk and is not suitable for every investor. Past performance does not guarantee future results. All signals, analysis, and community results are for educational purposes only and should not be considered financial advice. Always use proper position sizing, define your stop loss before entry, and never risk capital you cannot afford to lose.