Market Snapshot#
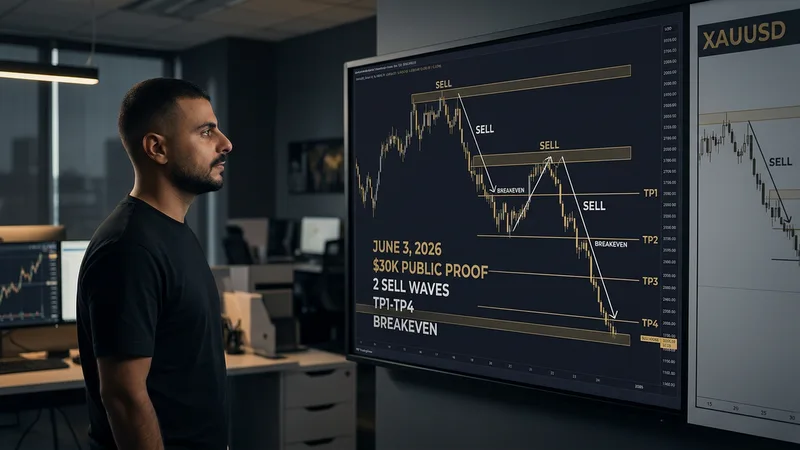
The strongest June 3 story was not a generic gold-market headline. It was the public @GTMO channel record showing a $30,000 day after two fast XAUUSD sell waves, TP1-TP4 progression, and a clear breakeven exit message before the session moved on. This is a historical recap, not an instruction to trade now, and readers who want the next free gold updates plus FREE VIP channel access can message @GTMOBest now.
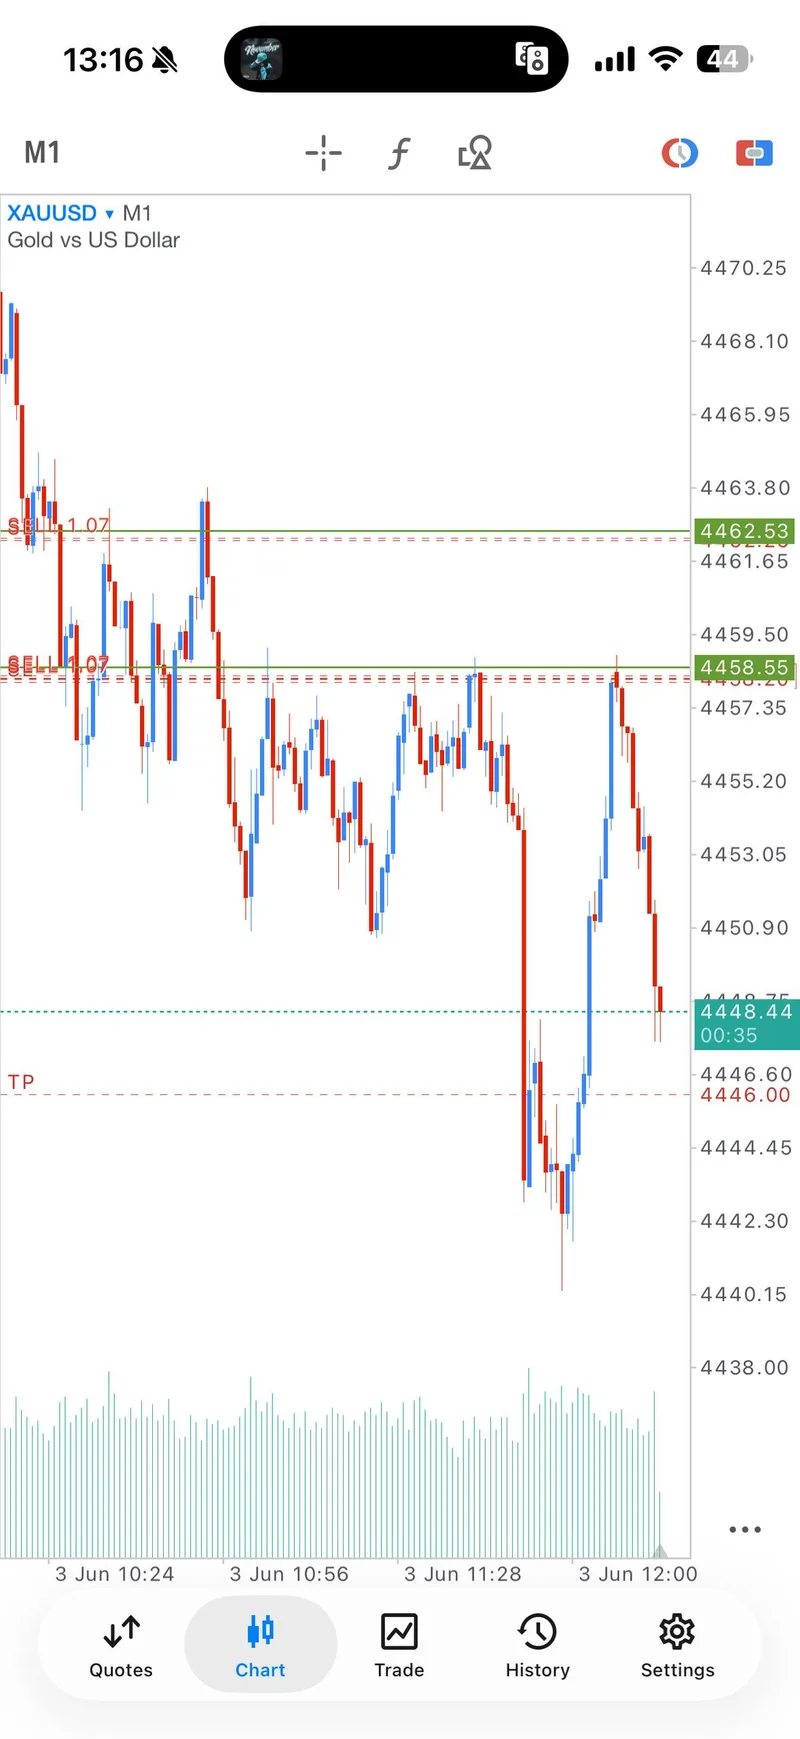
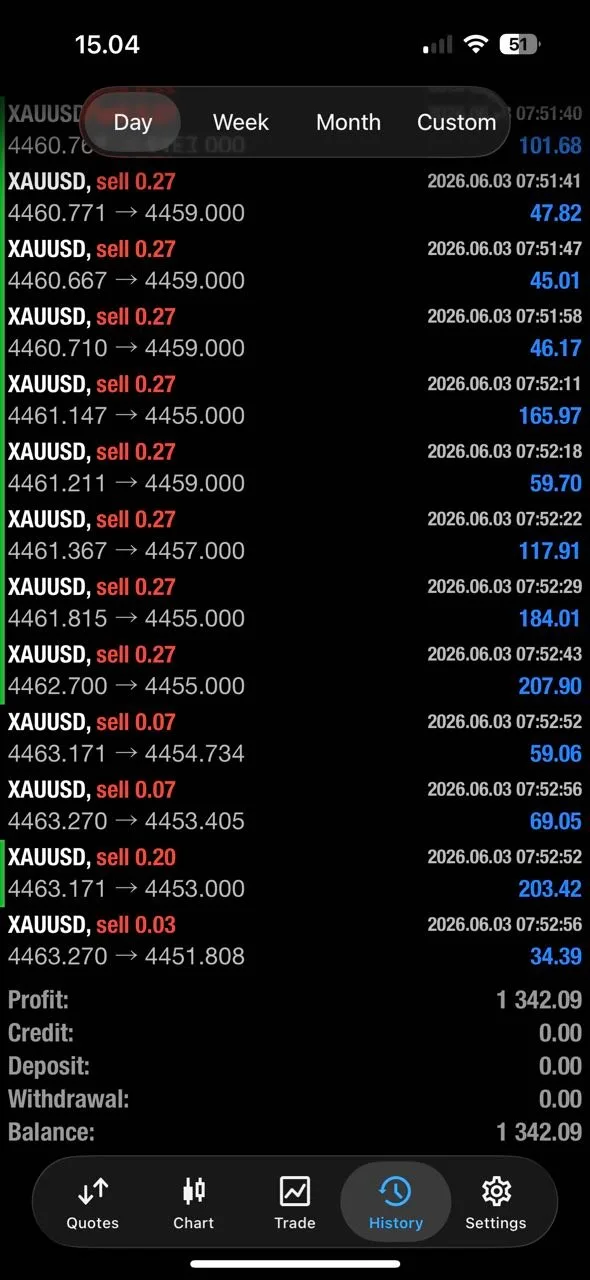
The same-day record started with SELL execution around the 4460.7-4464 zone, SL 4468, and targets at 4459, 4457, 4455, 4453, then open. Within minutes, messages shared publicly on @GTMO showed TP1, TP2, TP3, TP4, a 100+ pip trade in 7 minutes, and later a 160+ to 200+ pip waterfall extension. The proof is sequential: call, target progress, risk reduction, and member response all came from the same trading day.
Gold traded under the $4,500 area on June 3, with external market references showing a heavy, headline-sensitive session. Trading Economics referenced gold around $4,447.82 for June 3, while Vantage's XAUUSD CFD context placed the early-session range roughly between $4,462 support and $4,497 resistance. Because spot, CFD, and futures closes can differ by venue and timestamp, this recap treats those market figures as context, not as the main proof claim.
Why The Tone Changed So Fast#
The tone changed fast because the first sell wave did not ask readers to wait all day for confirmation. Mo posted the zone, price moved into the plan, and the public record quickly moved from entry context to TP1, TP2, breakeven, TP3, TP4, and 100+ pips. That is the kind of sequence a non-technical reader can understand without knowing every candle pattern.
This was also different from a recovery-only story. On June 2, 2026, the value of the recap was the way the public record recovered after pressure. On June 3, the story was cleaner: sell-side structure showed up, Mo protected entries quickly, and members responded while the proof was still fresh. That contrast helps readers see GTMO as a process, not a random scoreboard.
Across the same-day public record, the public channel contained 120 member feedback messages. The published gallery uses 11 selected public proof screenshots so readers can separate the full response from the clean visual proof used in the article.
Technical Outlook#
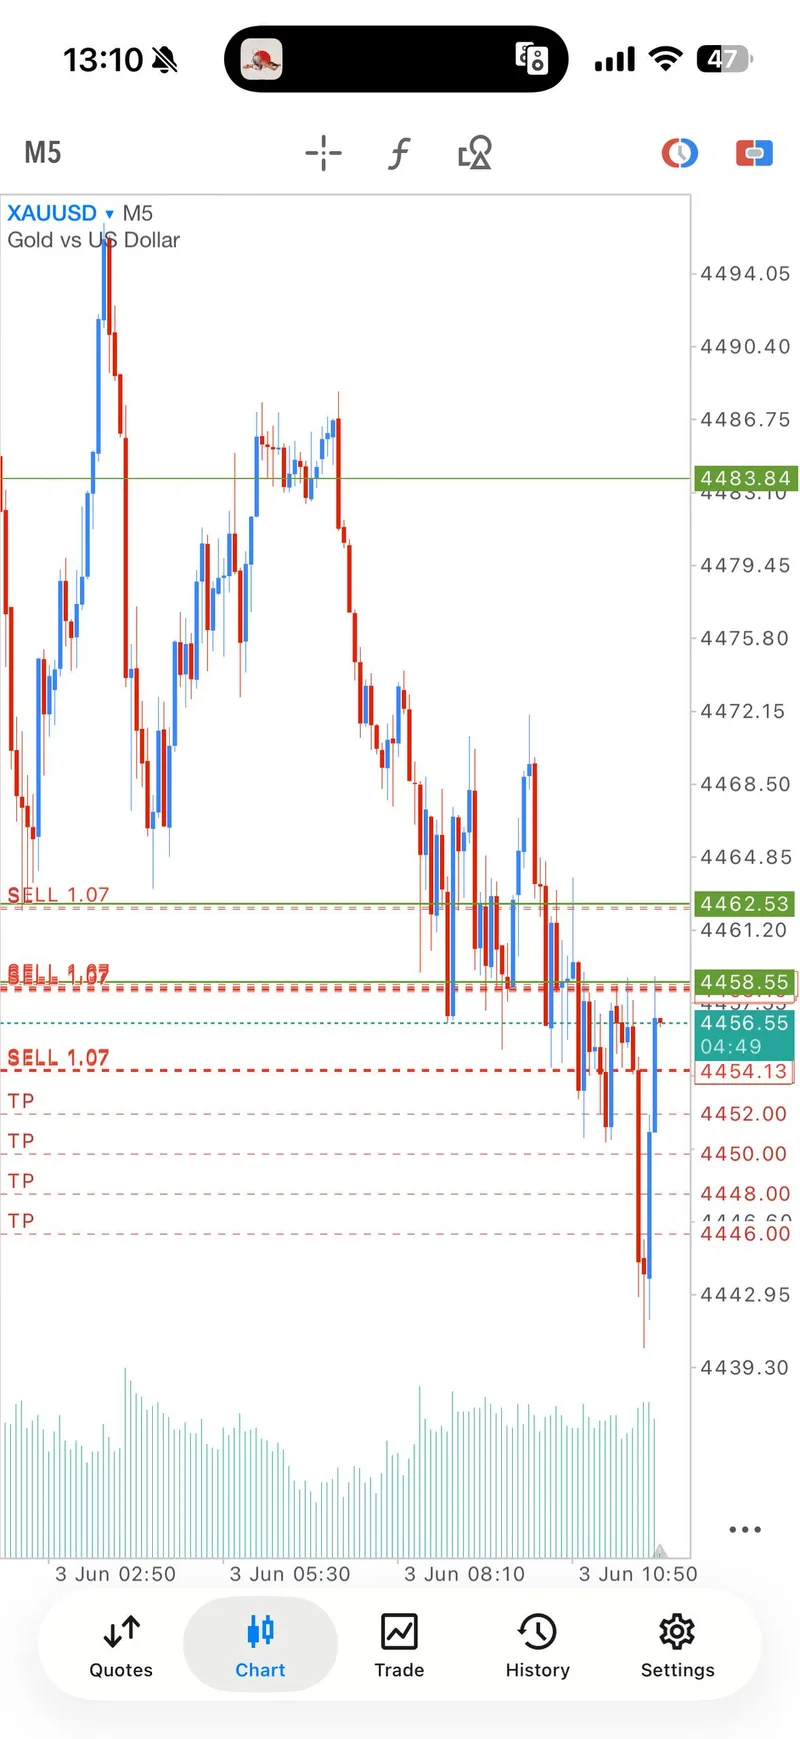
Technically, the day rewarded sellers while gold stayed below the $4,500 area. The first useful decision zone was the 4460.7-4464 sell area, because the public record connected that zone to four fixed targets and an open runner. The wider market context supported that read: dollar strength near 99.5, US 10-year yields around 4.49%, and headline-sensitive oil near $96 kept pressure on gold while traders waited for more US labour data.
The level map stays simple for readers: resistance was visible around the $4,497 area in the Vantage CFD context, with broader resistance references near $4,560-$4,570; support references sat near $4,460 and then the $4,430-$4,440 area. Those levels are not fresh trade instructions. They explain why the June 3 sell execution made sense in hindsight and why Mo's risk control mattered once price started paying.
For comparison, June 1, 2026 was a different type of proof day, with the report leaning more on the broader daily result. June 3 is stronger as an execution case study because the article can show the call, the targets, the breakeven language, the second sell wave, and the member response in order.
Trading Signals#

Signal 1#
The first SELL note was brief: "Gold sell now." By itself, that would not be enough for a strong public recap. Its value comes from the next message that clarified the trade zone and target ladder, plus the updates that followed within minutes.
This is why the report does not turn a one-line direction into a marketing claim. It uses the full same-day sequence to show what happened after the idea was posted publicly.
Signal 2#
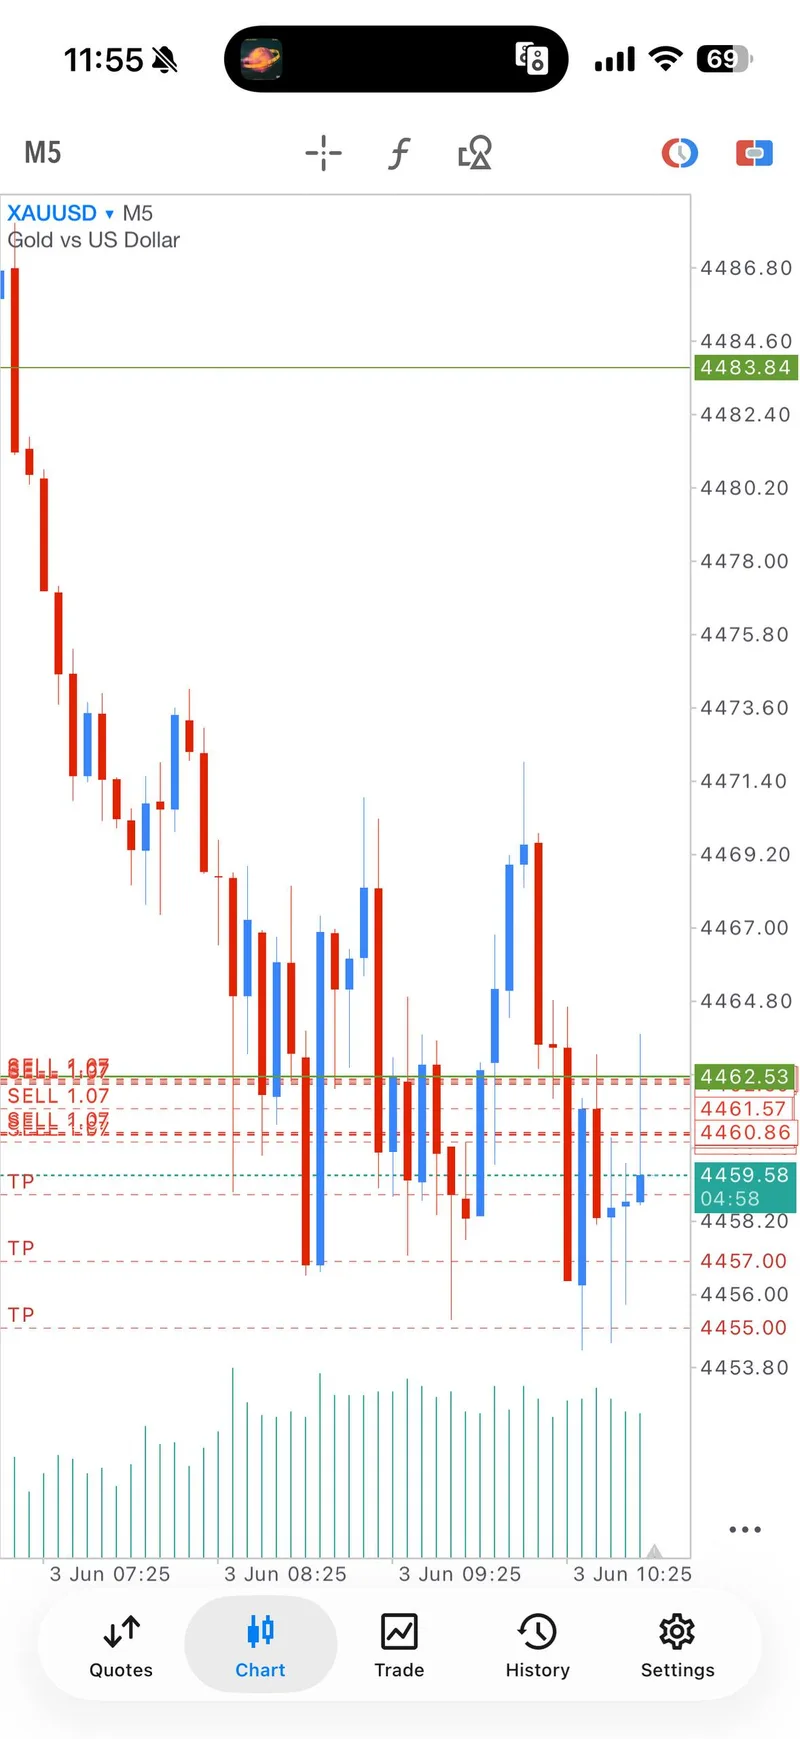
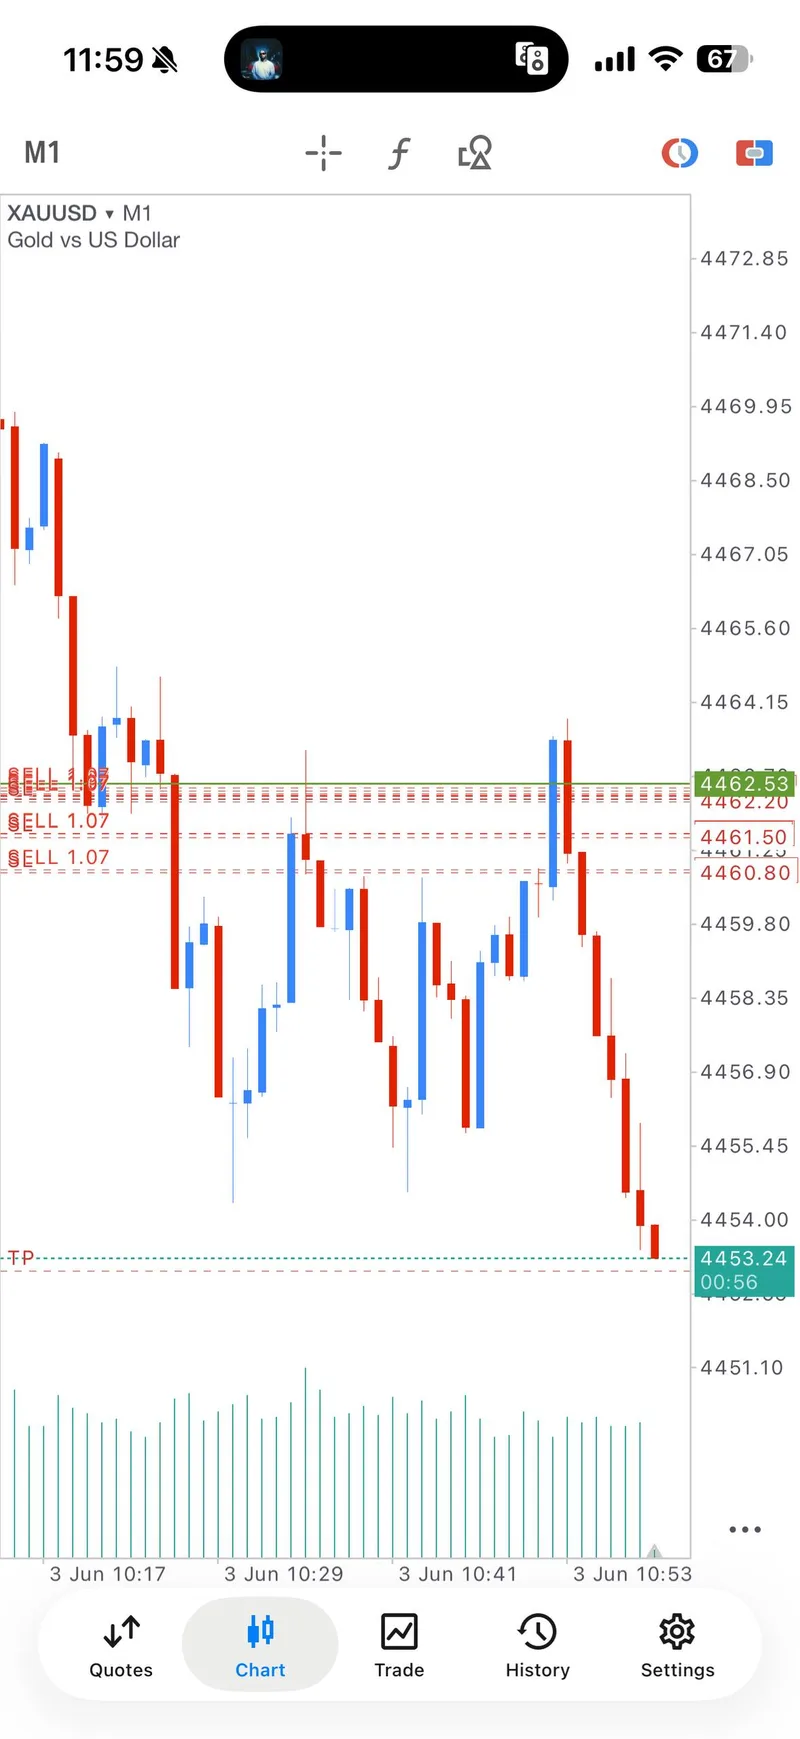
The clearest same-day setup was the SELL around 4460.7-4464 with SL at 4468 and targets at 4459, 4457, 4455, 4453, then open. Public @GTMO updates then showed TP1, TP2, breakeven, TP3, TP4, and a 100+ pip move in 7 minutes. Later updates extended that same waterfall narrative to 160+ and 200+ pips as Mo closed another entry.
The professional part was the risk language. TP2 came with breakeven guidance, which changed the session from a high-pressure trade into a managed trade. That is the difference between showing a result and showing a process.
Signal 3#
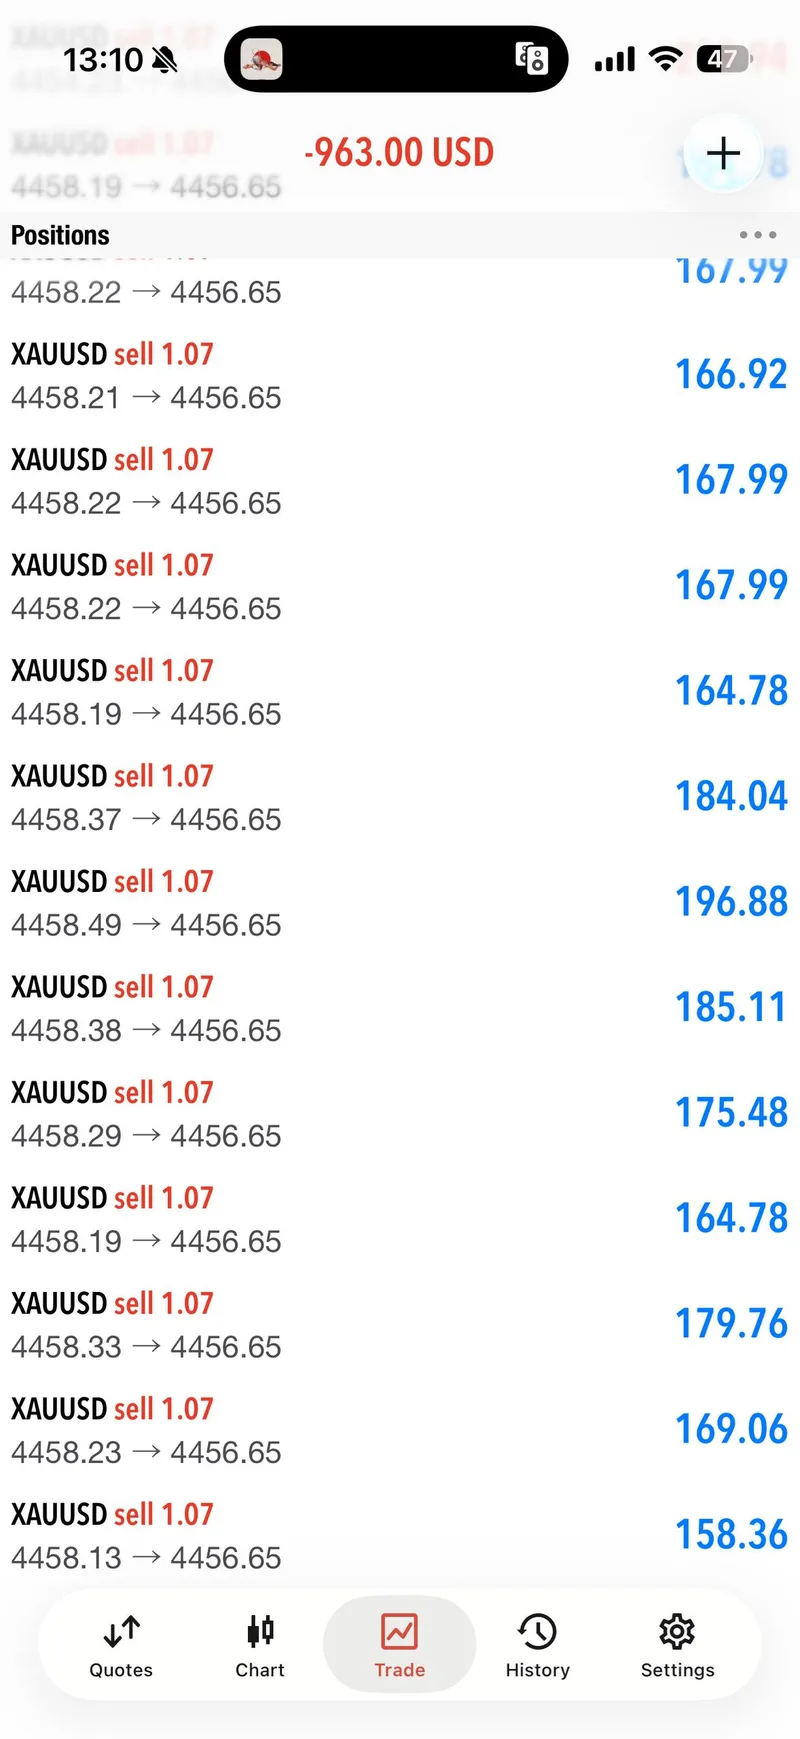
The second sell wave showed the risk-management habit again. The record included "Already touched our top of the zone," followed by instant risk-reduction language, profit updates, first entries closed, breakeven management, TP1 through TP4, and a 170+ pip update. The final breakeven message matters because it frames the day as managed execution rather than uncontrolled chasing.
This second wave also gave the public channel a conversion story without needing hype: people who missed the first waterfall could still understand why Mo was telling readers to contact @GTMOBest for access.
Signal Performance Breakdown#
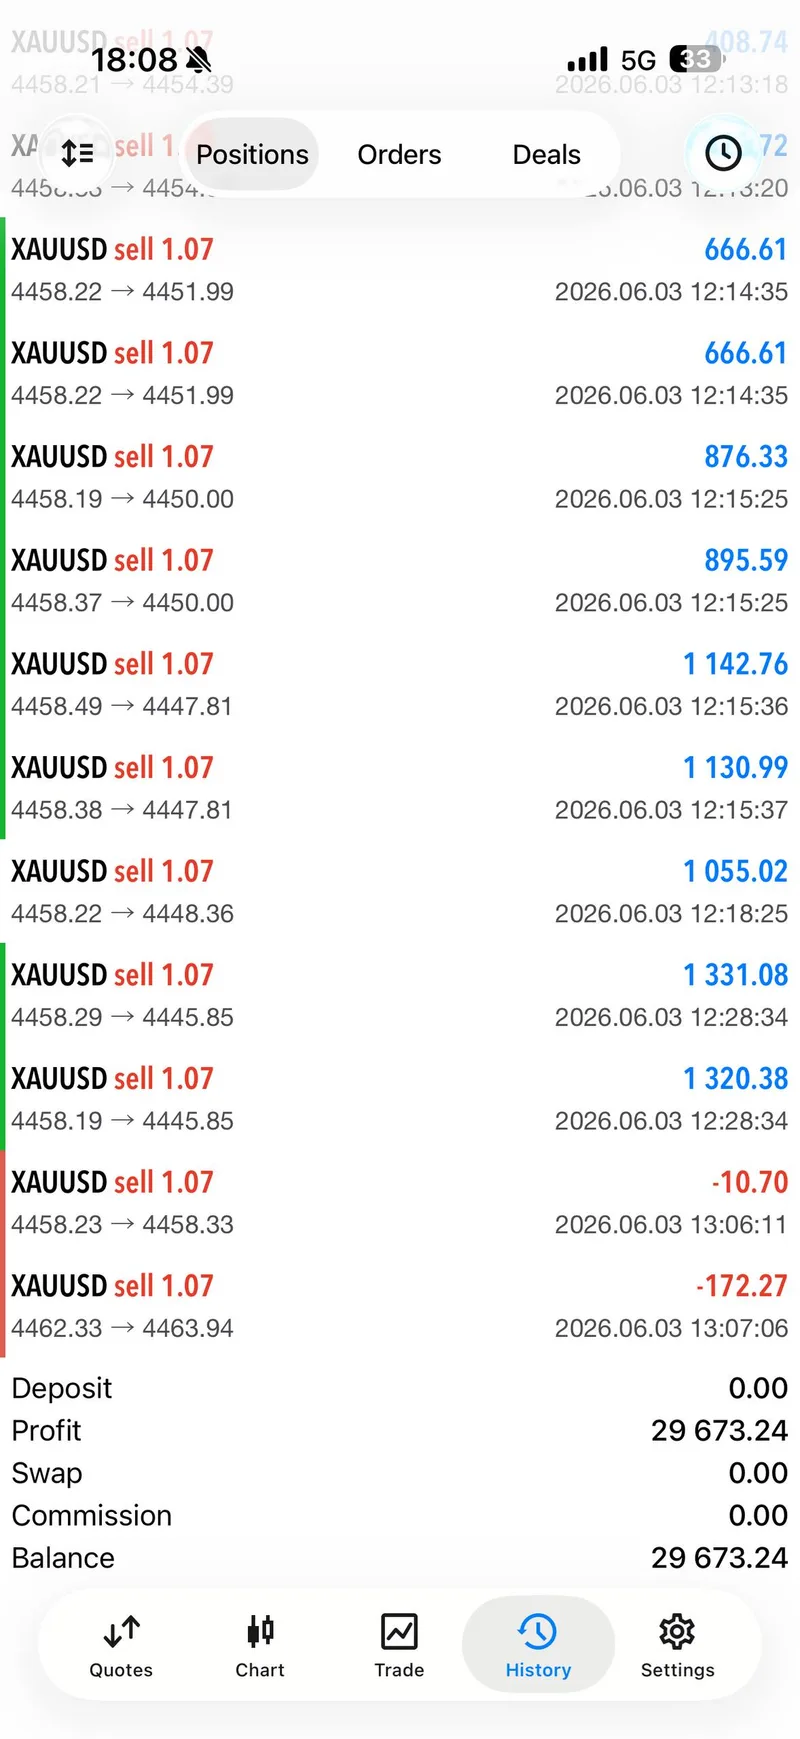
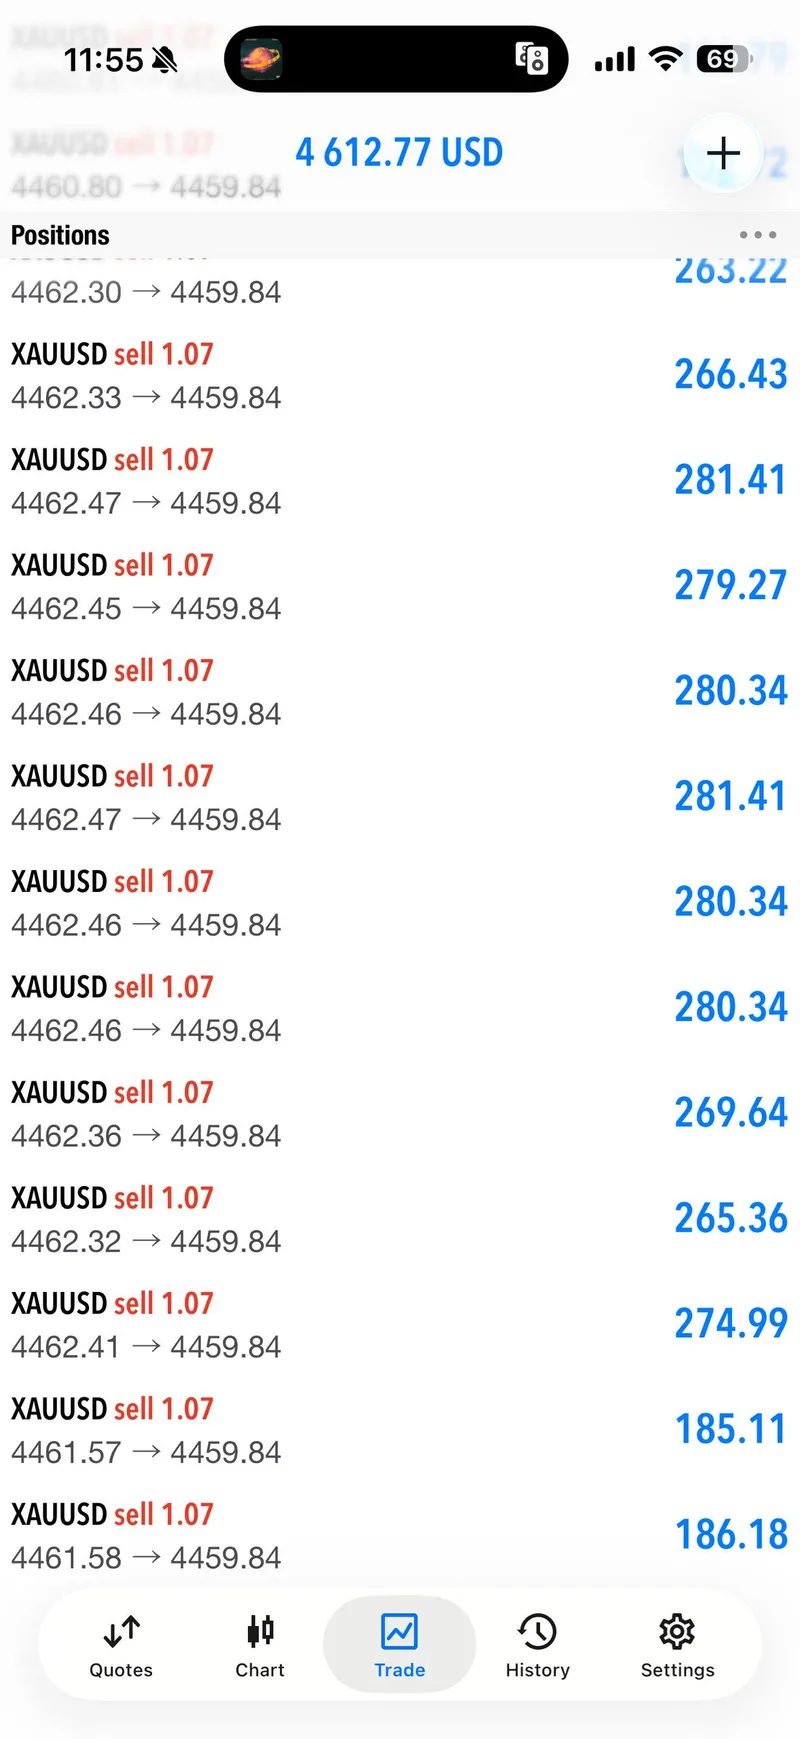
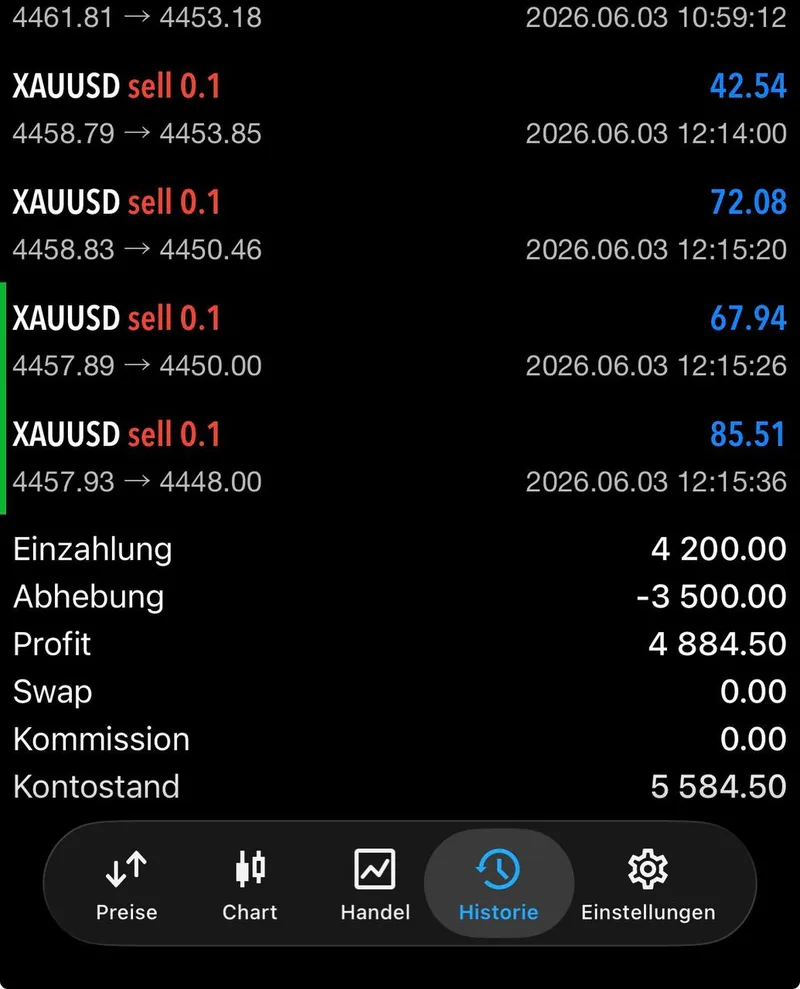
The strongest same-day claim was the public $30,000 day summary. The claim appeared after the trade sequence and member response, so the article frames it as a public @GTMO record claim, not as an independently audited account statement. That framing keeps the report persuasive without weakening trust.
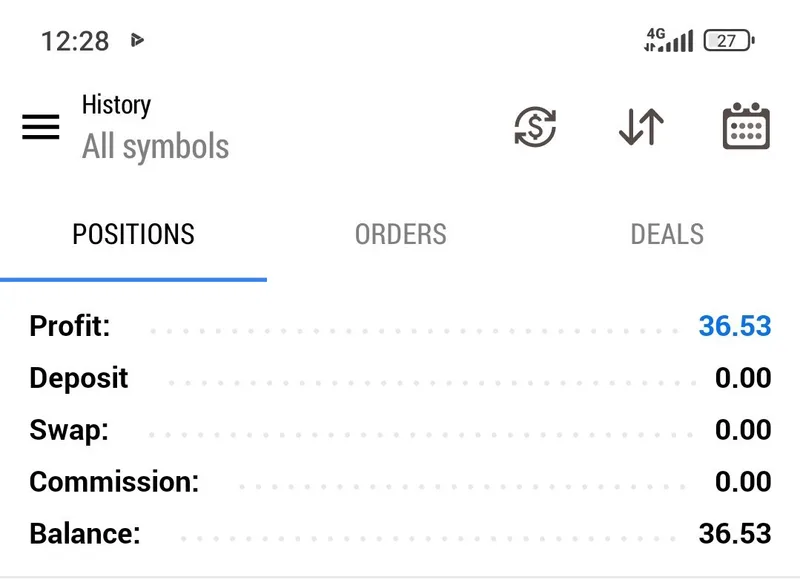
Member feedback made the scoreboard more human. Musa wrote, "266 Profit with the last trade amazing." Adrian Hooper wrote that he made just short of 300 before 9 a.m. and later said he was done for the day after 555 in 10 minutes. Pierre Pierre reported +1280 euros early, then later 2950 euros on the day. A.N. wrote that a single trade produced 120 pounds profit. Those messages do not remove trading risk, but they show how the session landed with real members watching the same public @GTMO sequence.
The selected screenshots support the story visually: a day-summary proof image, first sell-wave progression, second sell-wave risk reduction, TP4 progress, and member feedback. The total count and selected count are intentionally separate: 120 member feedback messages were counted, and 11 selected public proof screenshots are used in the gallery.
Execution Lessons#
The practical lesson from June 3 is that the best evidence is ordered evidence. A reader can follow the sell zone, the targets, the breakeven instruction, the second sell wave, the final breakeven exit, and the member response. That order is what makes the recap stronger than a detached market note.
The second lesson is that Mo did not need to hide risk. The public record showed protection language while the move was unfolding: TP2 hit, breakeven set, first entries closed, best entries held, and later all entries out at breakeven. Strong trading communication should make people calmer after entry, not more emotional.
For a broader proof trail, compare this with May 29, 2026. That report showed a Friday proof day; June 3 adds a cleaner intraday management story. Together, the reports help new readers see why Gold Trader Mo focuses on public proof instead of asking people to trust vague claims.
What The Day Means Going Forward#
For non-technical readers, June 3 means Mo's public record is readable. The proof showed timing, targets, risk control, and member response in the same day. That is why the CTA belongs near the proof rather than hidden at the bottom.
Readers should not treat a completed historical signal as a new instruction. The useful action is to follow the free lane, watch how Mo communicates before and after a move, and message @GTMOBest for free gold signals plus FREE VIP channel access.
The day also shows why daily recaps matter. A chart alone can be cherry-picked. A public sequence with signal context, TP progression, breakeven management, selected proof screenshots, and member feedback is harder to fake and easier for a new reader to judge.
FAQ#
Is this a live trading signal?#
No. This is a historical recap of the June 3, 2026 gold session. It documents what was shared publicly on @GTMO and how the session was managed after the fact.
What was the strongest same-day claim?#
The strongest same-day claim was the public $30,000 day summary, supported by the same-day sell sequences, TP progression, breakeven management, and member feedback messages.
How many member responses were counted?#
The same-day public record contained 120 member feedback messages. The published gallery uses 11 selected public proof screenshots so the article stays readable.
Where should new readers go next?#
Message @GTMOBest for free gold signals and FREE VIP channel access, then follow the free public channel for the next GTMO updates.
Connect with Gold Trader Mo#
Follow Gold Trader Mo for the public trading record, read the latest daily recaps, and message @GTMOBest for free gold signals plus FREE VIP channel access. Trading involves risk, capital can be lost, and past performance never guarantees a future result.