Market Dashboard (Macro-First Overview)#

Gold opened the day in recovery mode and followed through with a strong rebound from yesterday’s correction phase. XAUUSD closed at $5,187.79, up $41 (+0.77%), as geopolitical uncertainty and tariff aftershocks reinforced safe-haven demand. The macro tape remained mixed on paper—firmer DXY and higher U.S. 10Y yields typically weigh on bullion—but today’s price action showed that risk-sensitive flows and event risk were dominant over traditional headwinds.
| Indicator | Value | Change | Trend |
|---|---|---|---|
| XAUUSD | $5,187.79 | +$41 (+0.77%) | ↑ |
| DXY | 97.93 | +0.07 (+0.07%) | Short-term ↑ |
| VIX | 19.55 | -1.46 (-6.95%) | ↓ 5-day down |
| 10Y Yield | 4.06% | +2 bps | ↑ |
| WTI Crude | $70.96 | +7.6% monthly | ↑ |
| Fear & Greed | 42.7 / 100 | Fear zone | — |
| Market Regime | RISK-OFF | Safe-haven active | — |
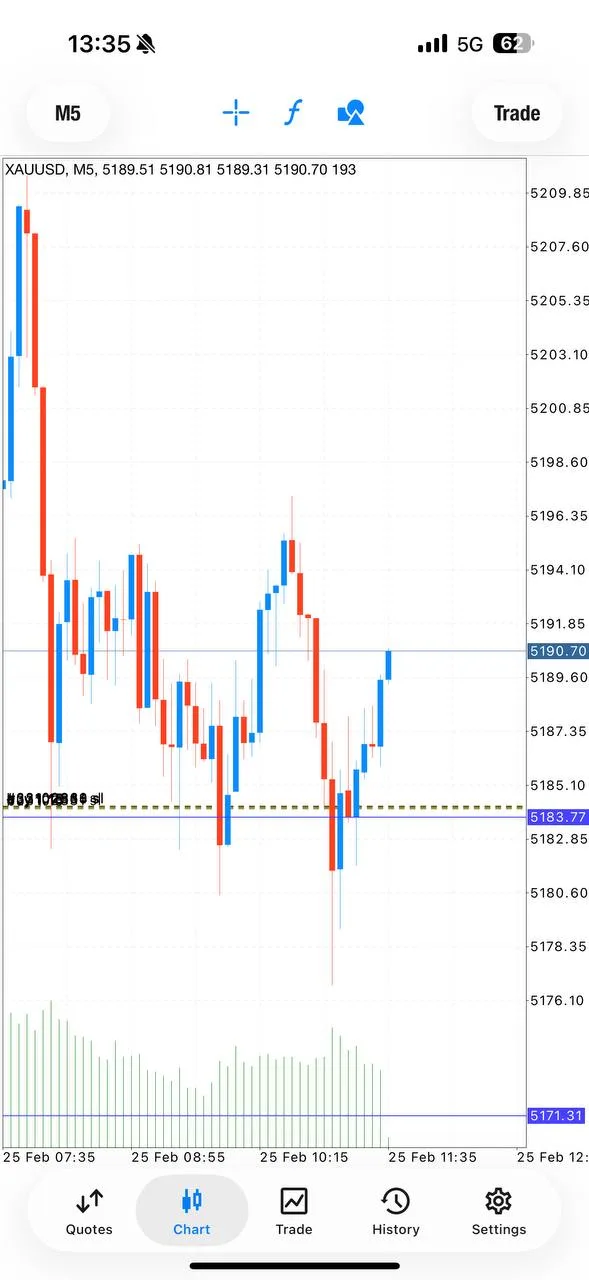
OHLC Structure
- Open: $5,146.80
- High: $5,210.57
- Low: $5,137.47
- Close: $5,187.79
The day’s narrative is clear: after the pullback session on February 24, buyers stepped back in aggressively near lower intraday zones and defended key structure. That context matters, because when gold can rise despite a mildly firmer dollar and yields, it usually signals that macro risk premia are being repriced.
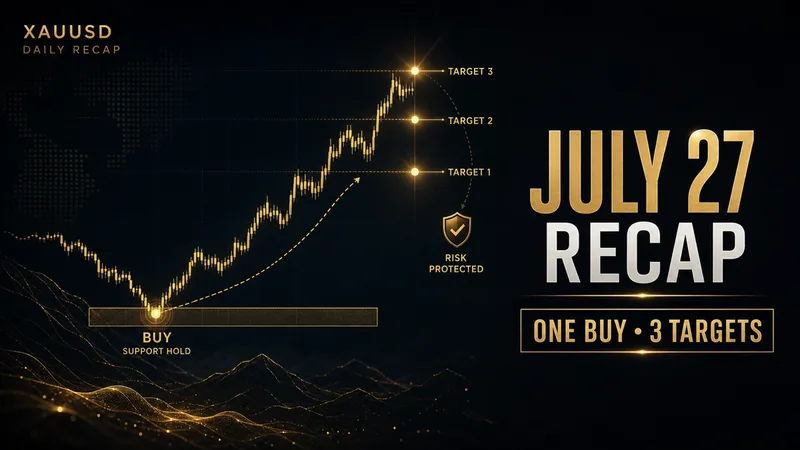
Executive Recap: What Drove Today’s Rebound#
Today’s move can be summarized in one line: gold rebounds from yesterday’s correction, rising 0.77% as Iran tensions and tariff aftershocks fuel safe-haven demand—traders ride the wave with two precision BUY scalps netting nearly $20,000.
This was not a random bounce. It was a technically and macro-supported recovery with clear catalysts and fast execution opportunities. The tape offered momentum bursts during headline windows, followed by shallow pullbacks that kept buyers in control. As a result, both posted BUY plans reached all take-profit levels quickly.
If you reviewed yesterday’s correction analysis, today’s session effectively validated the idea that the broader bull framework remained intact and that dip demand was still deep.
Top 3 Macro Drivers#
1) 🟢 US-Iran Nuclear Escalation (Impact: HIGH)#
Safe-haven demand was reinforced by elevated U.S.-Iran tensions and renewed diplomatic uncertainty heading into Geneva talks. Reports highlighted continued U.S. military buildup in the Middle East while Iran signaled sanctions-relief demands tied to uranium concessions. That combination kept geopolitical risk premium embedded in gold.
When diplomacy and military signaling move in opposite directions, markets tend to pay for optionality. Gold benefited from that repricing. Intraday behavior was consistent with headline-sensitive safe-haven inflows rather than purely technical drift.
2) 🟢 Trump 15% Global Tariff Shock (Impact: HIGH)#
The second major driver was the tariff shock transmission. The signed 15% global tariff under Section 122 (effective February 24 for 150 days) extended the prior day’s risk narrative into today’s trade. Even after the initial spike phase, markets continued to digest implications for inflation, supply chains, and cross-asset volatility.
Gold’s push toward the $5,208 area during the broader tariff repricing phase left a bullish footprint: participants were willing to own protection on geopolitical and policy uncertainty, not just on growth concerns. For context on the earlier policy impulse and market reaction sequencing, see the February 23 tariff reaction.
3) 🟢 Fed Rate Cut Expectations (Impact: MEDIUM)#
Rate expectations stayed supportive. CME FedWatch pricing around 97.9% probability of a 25 bps cut at the March 18, 2026 FOMC meeting helped anchor real-rate expectations. Current policy at 3.5%–3.75% remains restrictive enough that incremental easing expectations keep medium-term support under gold.
This is an important macro asymmetry: if growth softens, cuts support gold; if inflation risk re-accelerates from trade frictions, gold still retains hedge demand. That dual-support setup is one reason the medium-term structure remains constructive.
Central Bank Watch and Macro Cross-Currents#
- Fed: 3.5%–3.75%, held in January; next decision March 18; easing probability elevated.
- ECB: Hold in early February, with cuts still expected into mid-2026.
- BOJ: Policy rate at 0.75%, with a possible move toward 1% mid-2026.
- BOE: 3.75%, held with a 5-4 vote; further cuts still likely.
- Global Policy Direction: Broadly EASING, though uneven by region.
The key macro message is that policy paths are diverging in timing but converging in direction. For gold, that tends to preserve a supportive medium-term backdrop as long as geopolitical uncertainty remains elevated.
Geopolitical Risk Map (Next Sessions)#
| Theme | Risk Level | Market Interpretation |
|---|---|---|
| US-Iran negotiations + military posture | HIGH | Safe-haven bid remains sticky |
| Trade war / 15% tariff regime | HIGH | Inflation-volatility hedge demand |
| Russia-Ukraine infrastructure strikes | MODERATE | Background risk premium |
| Greenland strategic friction | LOW-MODERATE | Limited immediate pricing impact |
With this risk map, the baseline remains: dips are likely to attract buyers unless key supports fail on a closing basis.
Technical Structure and Positioning#
Key Levels#
| Level | Price | Significance |
|---|---|---|
| Immediate Support | $5,153 | Base of recent pattern |
| Key Support | $5,107 | Former resistance turned support |
| Immediate Resistance | $5,222–$5,230 | Pivot cluster |
| Key Resistance | $5,259–$5,271 | Overhead barrier |
| All-Time High | $5,595 | January 2026 peak |
Trend Engine (Moving Averages)#
- 20 EMA: ~$5,011 (price ~$177 above) → bullish short-term control.
- 50 SMA: $4,764 (price ~$424 above) → strong intermediate trend.
- 100 SMA: $4,448 → very bullish long-cycle support.
- 200 SMA: $3,951 → extremely bullish primary trend.
- MA Stack: Fully Bullish.
Momentum and Participation#
- RSI (14): ~59 → neutral-to-bullish, still room before extreme momentum.
- Stochastic: 90%K / 92%D → overbought, warns of short pullback risk.
- COT (Feb 10, 2026): Net long 212,808 contracts (down 1,700 WoW), still bullish but below 250k+ average seen at stronger trend moments.
- ETF Flows: Net inflows remain constructive; global holdings at 100.4M oz (+1.4% YTD) and Chinese ETF AUM at a record RMB 333bn.
The technical read is straightforward: trend remains up, momentum is strong but not exhausted on RSI, and overbought stochastic argues for tactical pullbacks rather than immediate trend reversal assumptions.
Signal Performance Breakdown (CamoFox Phase 1)#
Trading execution matched the macro setup almost perfectly: both posted plans were BUY, both reached TP1/TP2/TP3, and both delivered rapid follow-through with minimal hesitation. For readers looking to benchmark short-horizon execution quality, today is a clean example of momentum alignment between macro narrative and tactical entries.
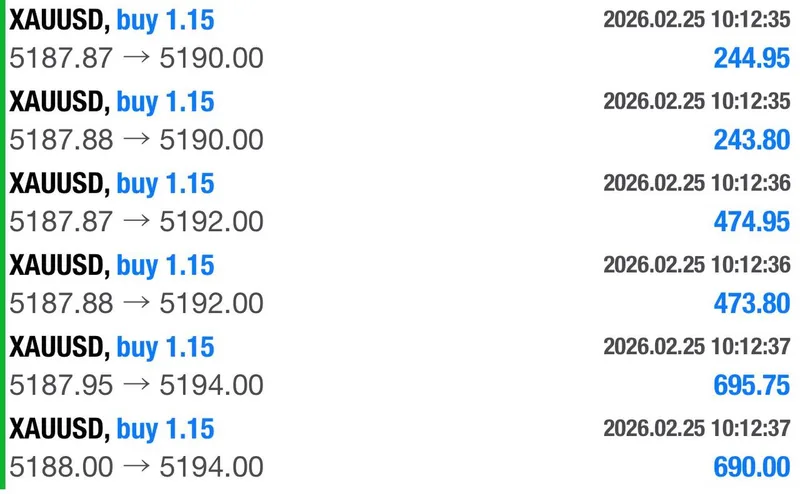
H3 — Signal 1 (FREE-FIRST)#
- Channel: Free channel
- Time: 00:12 ICT
- Direction: BUY
- Entry Zone: 5187.8 – 5185
- Stop Loss: 5181
- TP1: 5190 ✅ (~8 minutes)
- TP2: 5192 ✅
- TP3: 5194 ✅ (full ladder in ~11 minutes)
- Extension: 100+ pips run reached within ~25 minutes
- Cross-reference: member recap later showed entries around 5187.87–5188.00
This trade reflected textbook continuation behavior: tight risk box, immediate acceptance above entry, and fast progression through target ladder with no deep retrace into stop territory.
H3 — Signal 2 (SHARED IN BOTH CHANNELS)#
- Channels: Members + Free
- Time: 01:18–01:19 ICT
- Direction: BUY
- Entry Zone: 5184.2 – 5181
- Stop Loss: 5178
- TP1: 5186 ✅ (~1 minute, instant fill-and-go)
- TP2: 5188 ✅
- TP3: 5190 ✅ (full ladder in ~16 minutes)
- Extension: 100+ pips run reached within ~18 minutes
The second trade confirmed that buyers still controlled intraday flow after the first impulse. Importantly, TP1 was hit almost instantly, reducing psychological drag and allowing disciplined management through TP2 and TP3.
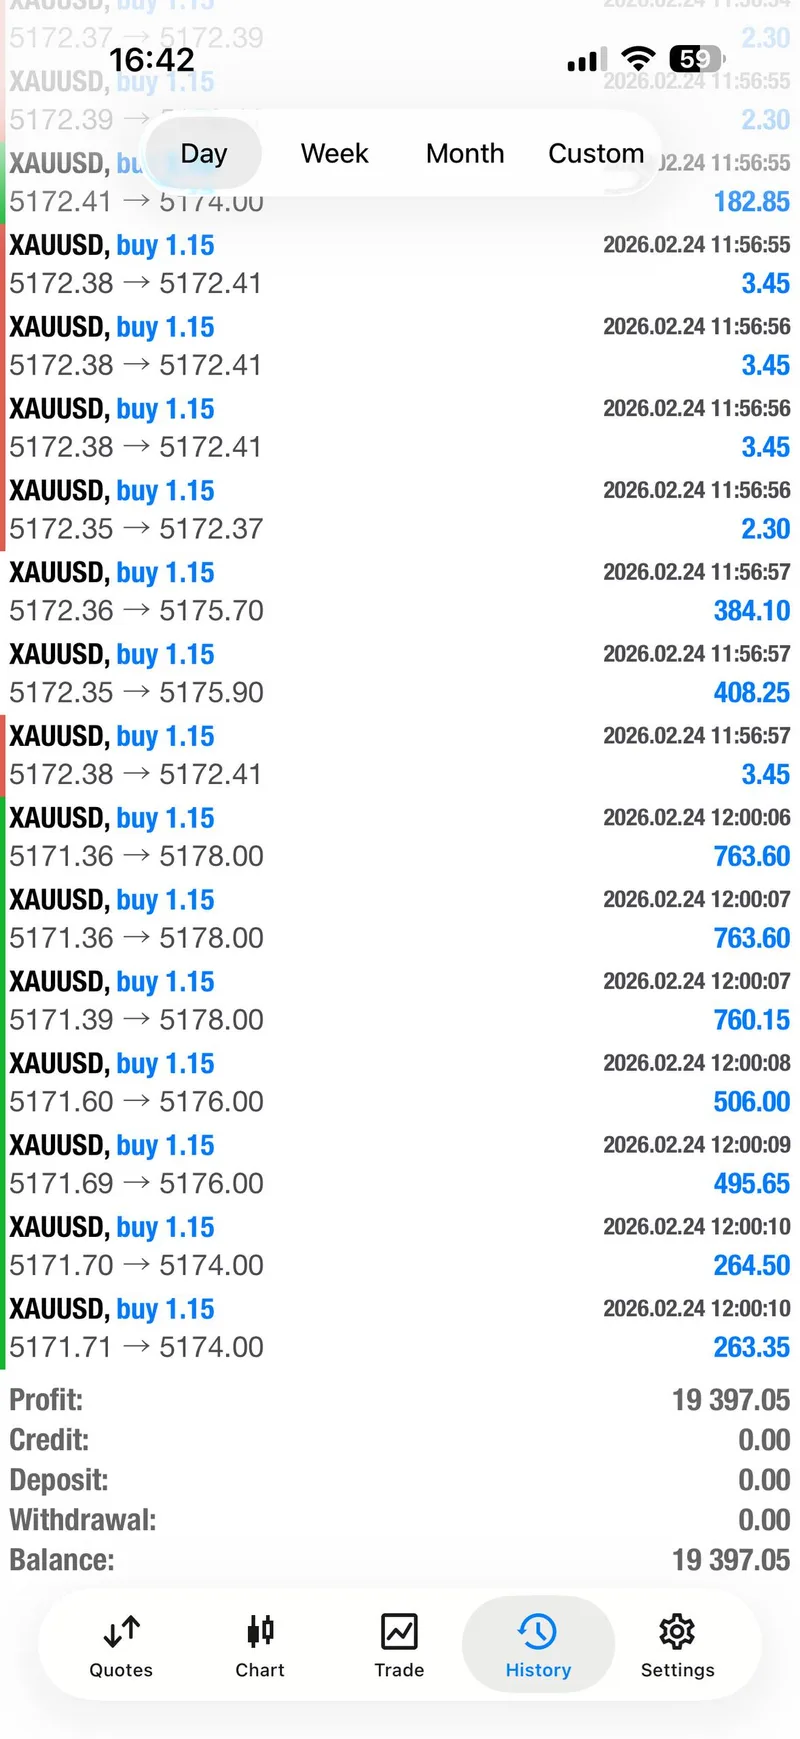
Daily Trading Scorecard#
| Metric | Result |
|---|---|
| Total Signals | 2 |
| Wins | 2 |
| Losses | 0 |
| Win Rate | 100% |
| Direction Mix | 2 BUY / 0 SELL |
| TP Completion | 6/6 targets hit |
| Claimed P&L | Nearly $20,000 |
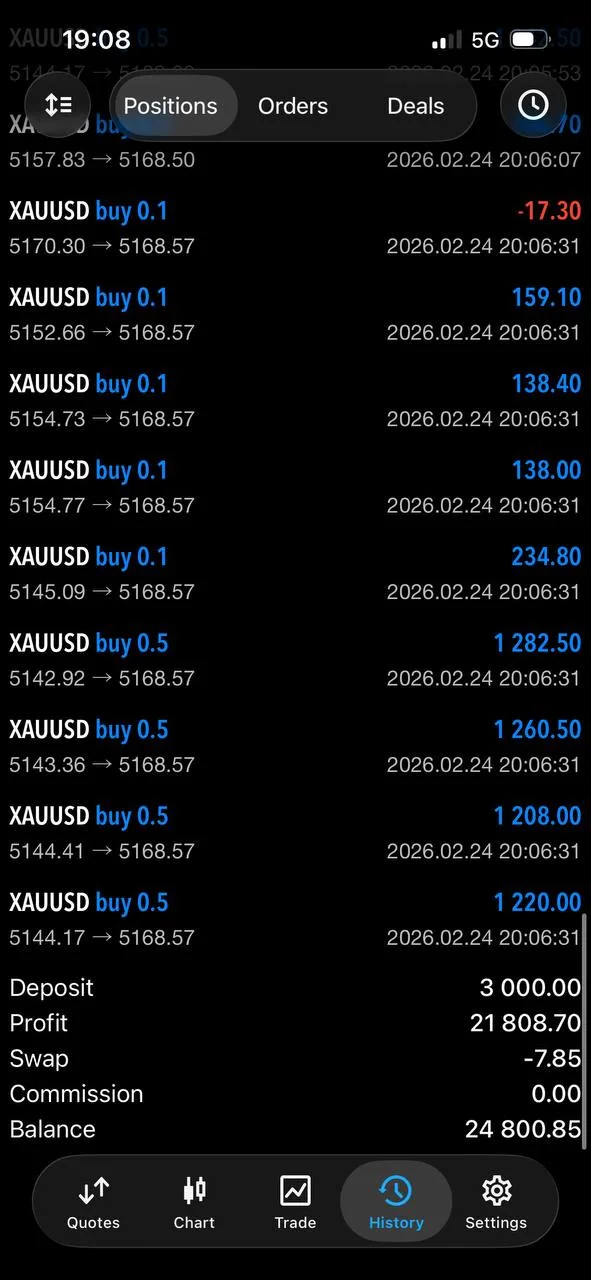
Mo’s day-end claim—“almost $20,000 PROFIT TODAY”—is consistent with the posted sequence and member outcomes shown in screenshots.


For broader context around strategy framing and consistency, compare this setup with the weekly gold trading summary, especially how trend days reward disciplined ladder exits.
Community Proof and Member Outcomes#
A strong report is not only about signal accuracy; it is also about execution transfer to members across account sizes and experience levels. Today’s testimonials continue that pattern.
Selected Testimonials (7)#
Akbar: $3,000 → $21,800
Ranjini Ramesh: $300 doubled in 4 days
Kasper Børs Petersson: 6th winning week (23 wins, 2 losses)
Michelle Omokwe: Doubled money in 3 days
Lulu blue: $1,000 in 5 min
George: £160 today
Capo Bogdani888: +$150

Channel Footprint#
- GTMO Members: 30,981 subscribers
- GTMO TRADES (Free): 18,620 subscribers
These numbers matter because they indicate depth of participation and consistency of execution across both public and private audiences.
Scenario Matrix and 48-Hour Forward Plan#
Probability Matrix#
| Scenario | Probability | Trigger | Target |
|---|---|---|---|
| 🟢 BULL | 45% | Hold above $5,170 and close above $5,230 | $5,318 |
| ⚪ BASE | 40% | Range between $5,153 and $5,230 | $5,188 |
| 🔴 BEAR | 15% | Break and sustain below $5,107 | $5,037 |
Given today’s close at $5,187.79, price sits near the center of the base-to-bull transition zone. The next directional confirmation is a decisive close through the $5,222–$5,230 pivot cluster.
Economic Calendar (Next 48h)#
| Date/Time (UTC) | Event | Country | Previous | Forecast | Gold Impact |
|---|---|---|---|---|---|
| Feb 25, 05:00 | Eurozone CPI (Jan Final) | EU | — | — | MEDIUM |
| Feb 26, 13:30 | Durable Goods Orders (Jan) | US | — | — | LOW |
| Feb 27, 13:30 | US PPI (Jan) | US | — | — | HIGH |
| Feb 27, 14:45 | Chicago PMI (Feb) | US | — | — | MEDIUM |
Traders should track PPI most closely. A hotter print can lift inflation hedging demand while also lifting yields; the net gold response then depends on whether risk aversion or rate repricing dominates the first reaction window.
Strategic Read: How to Position the Next Session#
The tactical map remains trend-following with disciplined risk limits. If price holds above $5,170 and starts accepting above $5,222, continuation longs remain favored toward upper resistance. If momentum stalls and stochastic overbought conditions trigger a retrace, the first decision zone is around $5,153. Only a sustained break under $5,107 materially shifts short-term structure toward bearish continuation.
For traders refining execution playbooks, today reinforces why gold scalping is the most profitable strategy when macro catalysts and intraday momentum align. It also aligns with the selection framework in the best gold trading signals in 2026, where timing, reaction speed, and ladder management are the core performance differentiators.
FAQ#
Why did gold rise even though DXY and U.S. yields were slightly higher?#
Because today’s session was primarily driven by risk-premium repricing. Geopolitical escalation and tariff uncertainty increased demand for safe-haven and inflation-hedge exposure, which outweighed the mild headwind from a firmer dollar and yields.
Is the market overbought after this rebound?#
Short-term, there is pullback risk: stochastic is overbought and the market is approaching a pivot cluster near $5,222–$5,230. However, broader trend structure remains bullish as long as support at $5,153 and especially $5,107 holds on closing basis.
What invalidates the current bullish setup?#
A clean break and sustained trade below $5,107 would weaken the current rebound thesis and raise probability for a move toward the $5,037 bear-scenario target. Until that happens, pullbacks are structurally viewed as retracement risk inside a broader uptrend.
Connect with Gold Trader Mo#
- 🆓 Free Signals: GTMO Trades
- 💬 Support: @gtmobest
- 📺 YouTube: GTMOFX
- 📸 Instagram: mojirjees
- 🌐 Website: Gold Trader Mo
Risk Disclaimer#
This report is for educational and informational purposes only and does not constitute financial advice, investment advice, or a solicitation to buy or sell any instrument. Trading XAUUSD and leveraged products carries substantial risk and may not be suitable for all investors. Past performance, posted signal outcomes, and community testimonials do not guarantee future results. Always use a defined stop loss, manage position size responsibly, and consult a licensed financial advisor before making trading decisions.