Weekly Gold Forecast Snapshot#
Gold opens the May 18-22, 2026 trading week in a cleaner but more dangerous place than the headline chart suggests. Friday did not give traders a calm close. It left XAUUSD sitting inside a wide post-flush decision zone, with one public close reference near $4,540 and another near $4,650. That conflict is exactly why this forecast treats the week as a zone battle, not a single-price prediction.
The thesis is simple: gold can recover if it defends the $4,500-$4,520 support band and reclaims $4,600-$4,665 with real follow-through. It can slide into a deeper liquidation week if Wednesday's FOMC minutes, long-end Treasury supply, or Thursday's growth/labor data keep yields and the dollar firm. If you want Gold Trader Mo's live read as those levels break or hold, message @GTMOBest for free VIP channel access.
This is not a week for lazy bullish or bearish slogans. It is a week for a decision map: the lower band proves whether sellers still control the post-flush tape, and the upper band proves whether buyers can rebuild trust before the next macro repricing.
Readers who want execution context can compare this weekly map with the Daily Gold Reports, the broader Market Analysis archive, and Mo's gold scalping strategy guide as the week develops.
Current Market Context#
The prior week ended with gold under pressure and the dollar-yield mix still uncomfortable for XAUUSD bulls. FRED's latest available 10-year Treasury yield print was 4.47% on May 14, while the Fed funds target range remained 3.50%-3.75% on May 15. DXY references from Investing.com showed the dollar pushing toward the high-98s to 99 area into Friday.
That matters because gold is still fighting the same three forces: real-yield pressure, dollar direction, and safe-haven demand. A softer dollar can help gold rebound quickly from support. A fresh yield squeeze can turn the same bounce into a trap. Mo's edge this week is not pretending the market has already chosen. It is waiting for the price action to confirm which macro force is actually in control.
The other important detail is the Friday close conflict. PriceGold and Mo's May 15 market packet place Friday's stress near $4,540, while GoldPrice.org lists a higher close near $4,649. That is not something to smooth over. For a public trader, the right response is to trade the zone: $4,500-$4,520 is the hard lower defense, $4,534-$4,541 is the Friday stress marker, and $4,600-$4,665 is where a recovery has to prove itself.
The Main Drivers That Could Move Gold This Week#
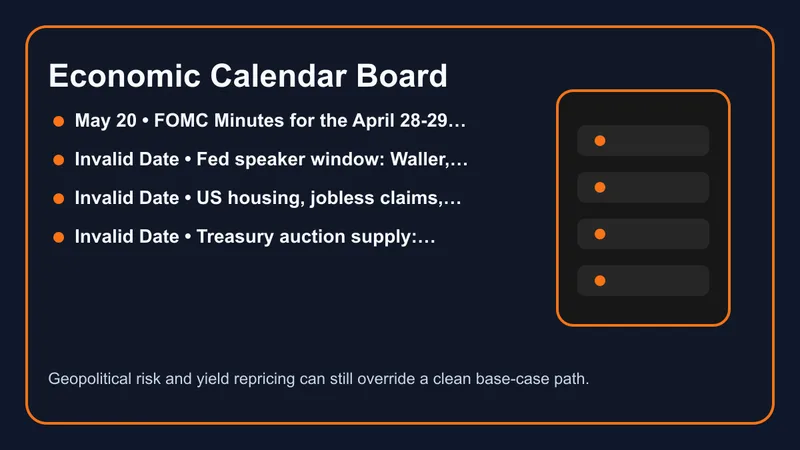
The calendar is not packed with top-tier inflation or payroll data, but it is still dangerous. Wednesday brings the FOMC minutes from the April 28-29 meeting at 2:00 p.m. ET. Thursday concentrates weekly jobless claims, housing starts, building permits, the Philadelphia Fed Manufacturing Index, and S&P Global flash PMIs. Friday adds revised University of Michigan consumer sentiment and the Conference Board's Leading Indicators Index.
Treasury supply is the quiet catalyst. The Q2 Treasury schedule shows a 20-year bond auction on Wednesday, May 20, and a 10-year TIPS auction on Thursday, May 21. Those are not decorative calendar items for gold. If demand is weak and yields press higher, XAUUSD support can fail even without a dramatic headline. If auctions pass cleanly and yields cool, buyers get room to test the upper band.
Fed communication adds the final layer. The official Fed calendar lists Christopher Waller on May 19 and May 22, and Michael Barr on May 20. The market does not need a rate decision to move. It only needs enough language around inflation, financial conditions, or policy patience to change how traders price real yields.
Key Technical Levels And Decision Zones#
The first support band is $4,500-$4,520. If gold holds there and rejects lower prices, the market is telling us that Friday's flush was absorbed rather than extended. The next reference is $4,534-$4,541, the lower Friday stress area used by Mo's May 15 market packet and PriceGold. A clean loss of that region would weaken the recovery thesis fast.
The first recovery test is $4,600-$4,625. A push above that zone is useful only if it holds on retest. The stronger upside gate is $4,650-$4,665. Above that, the market can start talking about a broader recovery toward $4,700-$4,720. Until then, rallies are only tests, not proof.
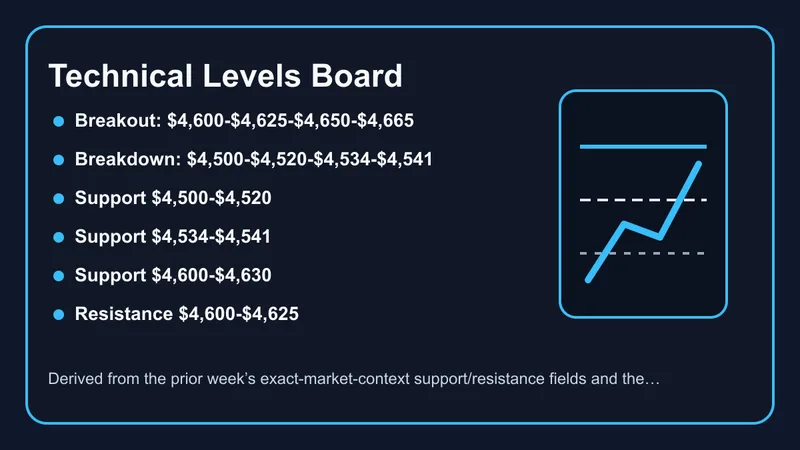
The weekly map is therefore:
- Support: $4,500-$4,520, then $4,534-$4,541 as the Friday stress marker.
- Recovery gate: $4,600-$4,625.
- Bullish confirmation zone: $4,650-$4,665.
- Extension resistance: $4,700-$4,720.
The cleanest trade behavior is patience at the middle of the range and decisiveness near the edges. Chasing the middle gives weak reward. Letting the edge confirm gives Mo a better read.
Bullish, Base, and Bearish Scenarios#
Bullish scenario#
Probability: 30%. Gold holds the lower band, absorbs Wednesday's FOMC minutes, and reclaims $4,600-$4,665 as yields cool or the dollar loses momentum. This scenario needs more than a fast green candle. It needs acceptance above $4,625 and a retest that does not collapse. If that appears, $4,700-$4,720 becomes the next realistic upside magnet.
Trigger: softer yield pressure, weaker dollar tone, stable auction reaction, or growth data that supports rate-cut expectations without creating panic.
Invalidation: a failed breakout back below $4,600, especially if yields rise at the same time.
Base scenario#
Probability: 45%. Gold rotates between $4,500-$4,520 support and $4,600-$4,625 resistance while the market waits for FOMC minutes, Treasury auctions, and Thursday's data cluster. This is the most practical starting point because the Friday close conflict argues against overconfidence. The base case stays alive while support holds, yields stay firm but not disorderly, and rallies fail to close cleanly above $4,625.
Invalidation: a decisive break and hold above $4,650-$4,665 shifts the week toward the bullish scenario. A decisive break below $4,500-$4,520 shifts the week toward the bearish scenario.
Bearish scenario#
Probability: 25%. Gold loses $4,500-$4,520 and sellers keep price pinned below the Friday stress zone. This path becomes more credible if FOMC minutes sound hawkish, Treasury auctions lift yields, or Thursday data keeps the dollar bid. In that setup, the market stops treating dips as opportunity and starts treating bounces as exits.
Trigger: higher yields plus DXY strength while XAUUSD cannot reclaim $4,541-$4,600.
Invalidation: a fast recovery above $4,600-$4,625 with improving candle structure.
Economic Calendar and Market Risks#
Monday, May 18 starts with the NAHB/Wells Fargo Housing Market Index. It is not usually a gold-dominant release by itself, but it helps set the growth tone before the heavier midweek tape.
Tuesday, May 19 brings pending home sales and Waller's policy-panel appearance. The market will listen for whether Fed language leans toward patience or optionality. Gold traders should watch DXY reaction more than the speech headline.
Wednesday, May 20 is the pivot day: FOMC minutes at 2:00 p.m. ET, Barr's official appearance, and the 20-year Treasury auction. If yields climb after this combination, gold's lower band comes under pressure. If yields cool, $4,600-$4,665 becomes the battleground.
Thursday, May 21 is the data cluster: jobless claims, housing starts, permits, Philly Fed, flash manufacturing PMI, flash services PMI, and the 10-year TIPS auction. This is the most important day for real-yield sensitivity.
Friday, May 22 brings revised University of Michigan sentiment, Leading Indicators, and Waller's economic outlook lecture. By then, the question should be whether the week has accepted a breakout, accepted a breakdown, or trapped both sides inside the range.
How To Think About Positioning This Week#
The actionable lesson for non-technical traders is straightforward: do not confuse urgency with chasing. This week is urgent because the market is sitting near decision levels while Fed and Treasury catalysts arrive. That does not mean every candle deserves a trade. It means traders need a cleaner framework before the volatility hits.
For Mo, the plan is conditional. Above $4,600-$4,665, the desk can look for recovery confirmation. Below $4,500-$4,520, the desk has to respect liquidation risk. Between those zones, the market is asking for patience, not ego.
That is also why joining the live channel matters. The public article gives the map. The live desk read is where Mo updates the map as price, yields, and catalysts actually hit. Message @GTMOBest for free VIP access and keep the week in context.
FAQ#
What is the main gold catalyst this week?#
The key catalyst cluster is Wednesday's FOMC minutes, the 20-year Treasury auction, Thursday's data releases, and the 10-year TIPS auction. Together they can move yields, DXY, and XAUUSD sentiment.
What level decides the forecast?#
$4,500-$4,520 is the lower defense. $4,600-$4,665 is the recovery gate. Holding one side and accepting the other is what turns this from a range forecast into a directional week.
Is this a buy or sell signal?#
No. This is a weekly market forecast and risk map. Trading involves risk, and no forecast guarantees profit. Use the levels and catalyst timing to frame decisions, not to force trades.
Disclaimer#
This weekly gold forecast is education and market commentary only. Trading involves risk, capital can be lost, and past performance does not guarantee future results.