1. Market Snapshot — March 10, 2026#
Gold closed around $5,170 on March 10, 2026, up about $42.40 (+0.83%) from the prior close. The session reflected a difficult but realistic trading environment: price recovered well on the day, but intraday reversals were sharp and frequently targeted obvious stop zones before directional continuation. For GTMO, it was a mixed result day inside a broader two-week drawdown period, and the communication remained transparent from first signal to final close.
Market Dashboard#
| Metric | Value | Change | Trend |
|---|---|---|---|
| XAUUSD | $5,170 | +$42.40 (+0.83%) | ↑ |
| Gold Fear & Greed | 60 | Greed | ↑ |
Gold dipped toward the $5,130 area early and then rebounded as buyers defended support. The sentiment backdrop has shifted from fear-heavy behavior toward greed conditions, but this is not a "smooth trend" regime. It is a fast-liquidity regime: directional bias can be right while timing gets punished. That distinction defined this entire session.
2. Macro Drivers Today#
The structural backdrop for gold is still constructive, even while short-term execution remains difficult.
Lower Real Interest Rates (Bullish 9/10)#
The broader Fed cutting cycle narrative continues to suppress real rates versus 2025 highs, which supports gold on medium-term horizons. Even when intraday moves are disorderly, lower real yield pressure keeps dip demand active.
Central Bank Accumulation (Bullish 8/10)#
Persistent sovereign buying remains a core support pillar. Ongoing reserve diversification by institutions such as the PBOC and RBI helps keep long-term demand firm and reduces the probability of extended breakdowns without a major macro regime shift.
Geopolitical and Policy Uncertainty (Bullish 7/10)#
Ukraine risk, Middle East instability, and tariff-policy tension all reinforce gold's role as a hedge. These factors often produce two-phase sessions: first a volatility shock, then selective trend continuation after weak hands are cleared.
If you are still building fundamentals, the complete guide to gold trading for beginners provides the full framework used in these reports.
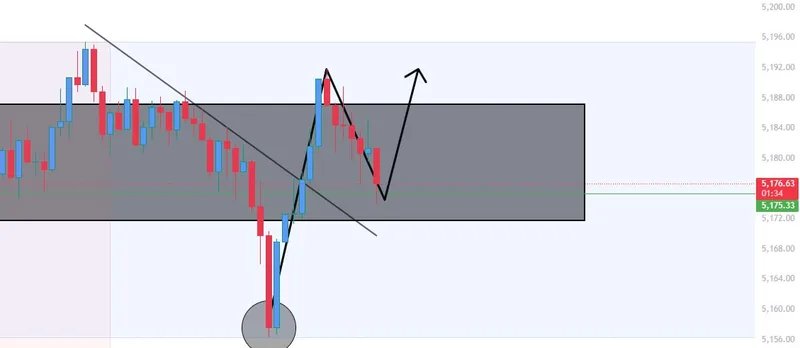
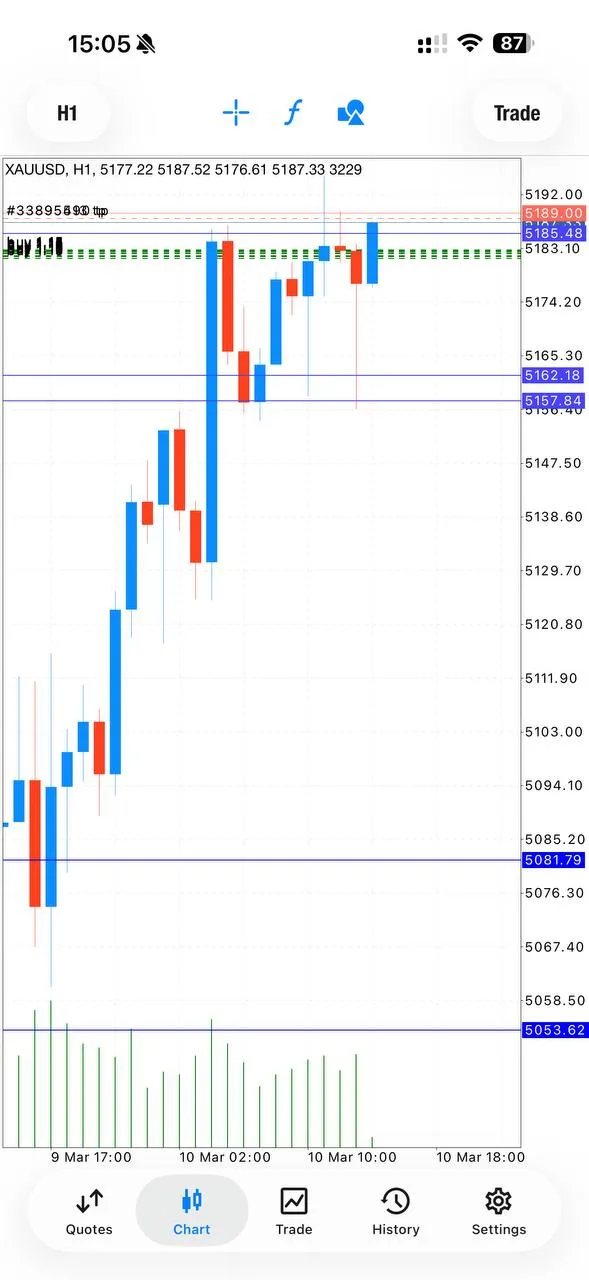
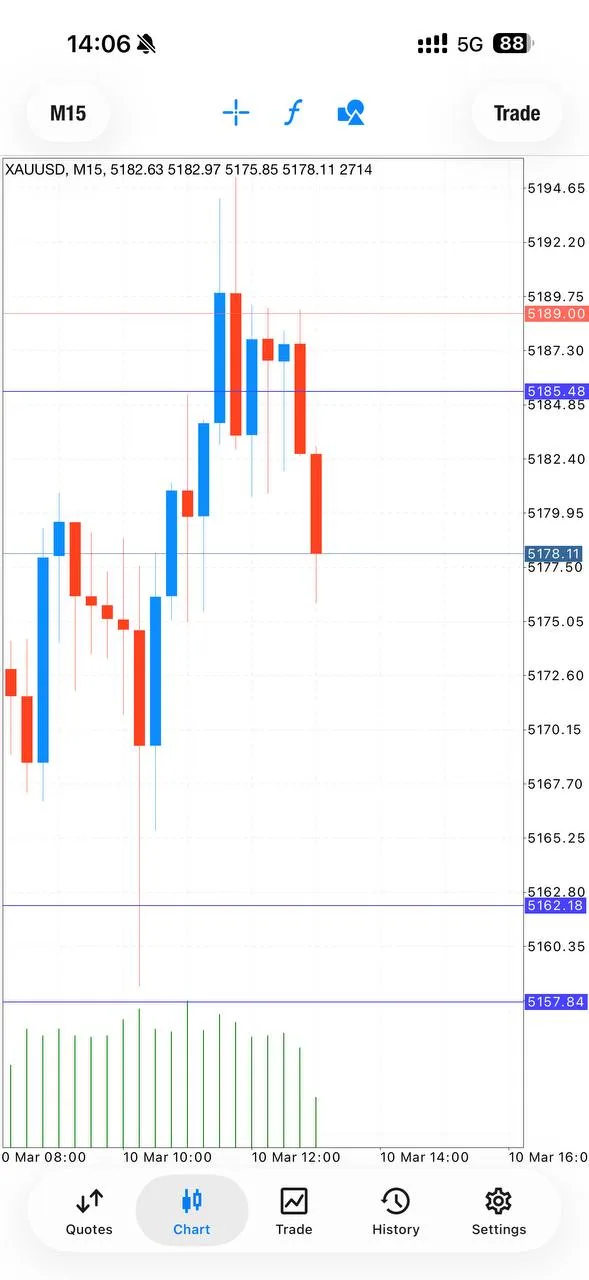
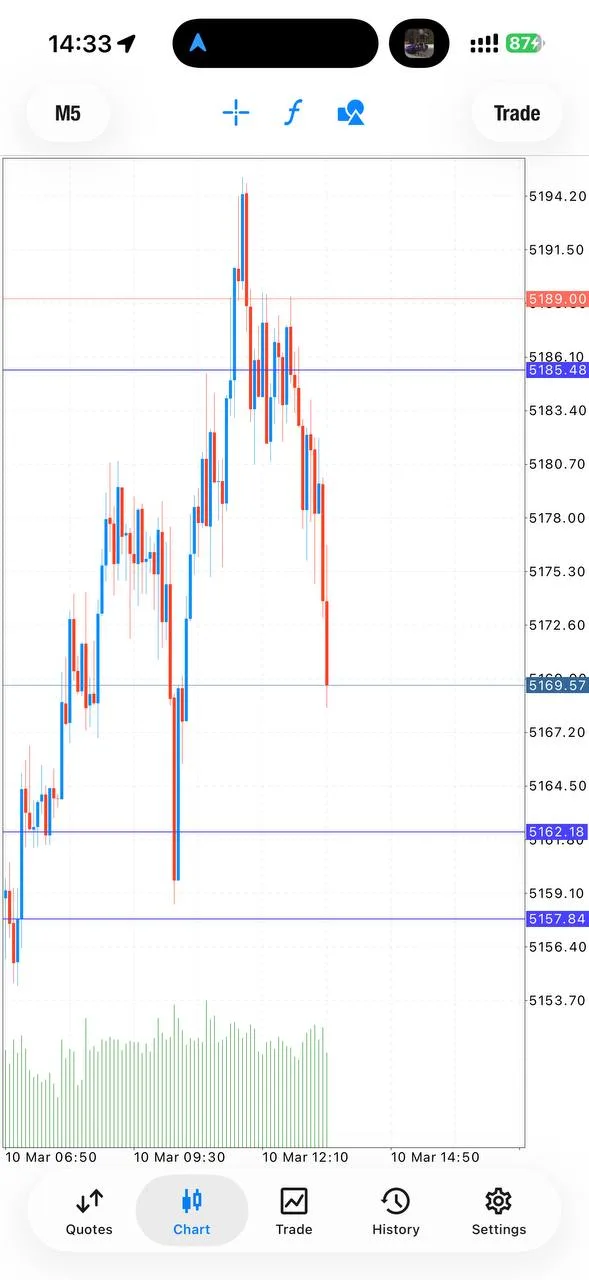
3. Technical Outlook#
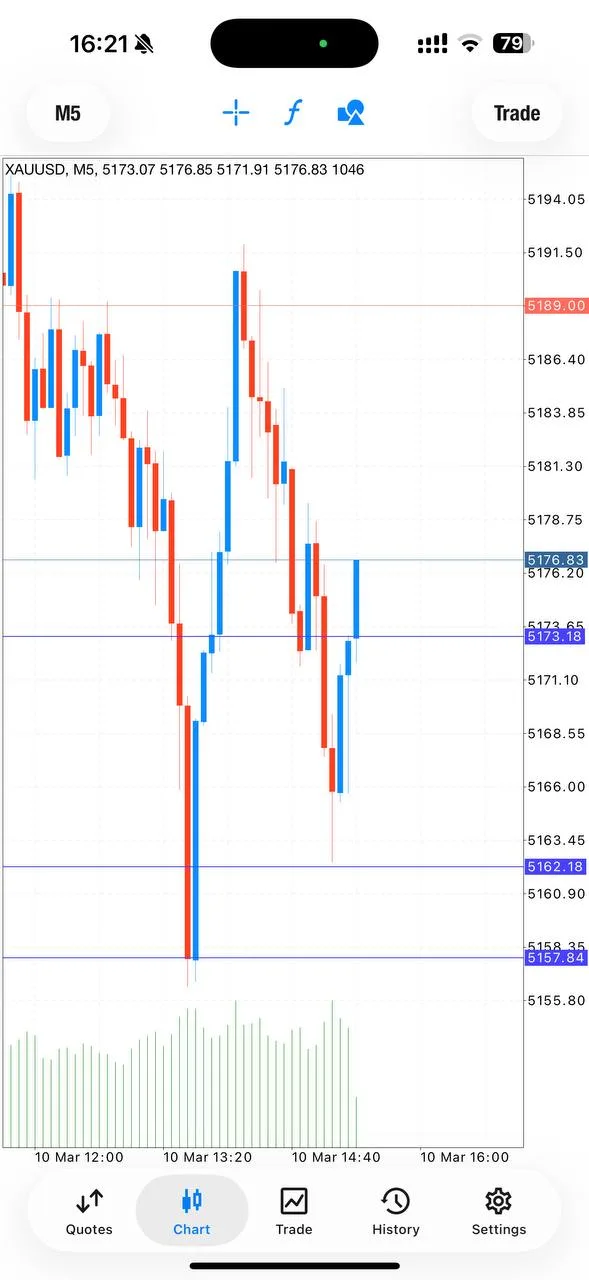
March 10 looked like a recovery day from Monday's weak close, but internally it was choppy and stop-sensitive.
Key Levels#
| Zone Type | Level | Why It Matters |
|---|---|---|
| Immediate Support | $5,140–$5,150 | First pullback demand |
| H4 Consolidation Support | $5,100–$5,115 | Mid-structure base |
| Major Support | $5,050–$5,060 | 61.8% retracement area |
| Psychological Floor | $4,995–$5,000 | Structural risk line |
| Near Resistance | $5,195–$5,210 | Intraday cap and breakout trigger |
| Major Resistance | $5,240–$5,260 | Prior swing highs |
| Overhead Barrier | $5,380–$5,420 | Upper macro resistance |
Indicator Picture#
- RSI(14) near 53 and rising: neutral-bullish bias.
- MACD positive and climbing: momentum recovery intact.
- Stochastic near 16: oversold rebound behavior.
This indicator mix is consistent with rebound potential, but execution still demands precision because reaction speed around support and resistance remains high. Traders can refine timing logic with the RSI tutorial for gold trading.
Scenario Matrix#
| Scenario | Trigger | Target | Probability |
|---|---|---|---|
| Bull | Break and hold above $5,210 | $5,240–$5,300 | 55% |
| Base | Hold $5,100–$5,210 range | $5,140–$5,240 consolidation | 30% |
| Bear | Daily close below $5,050 | $4,995–$5,000 | 15% |
4. Trading Signals#

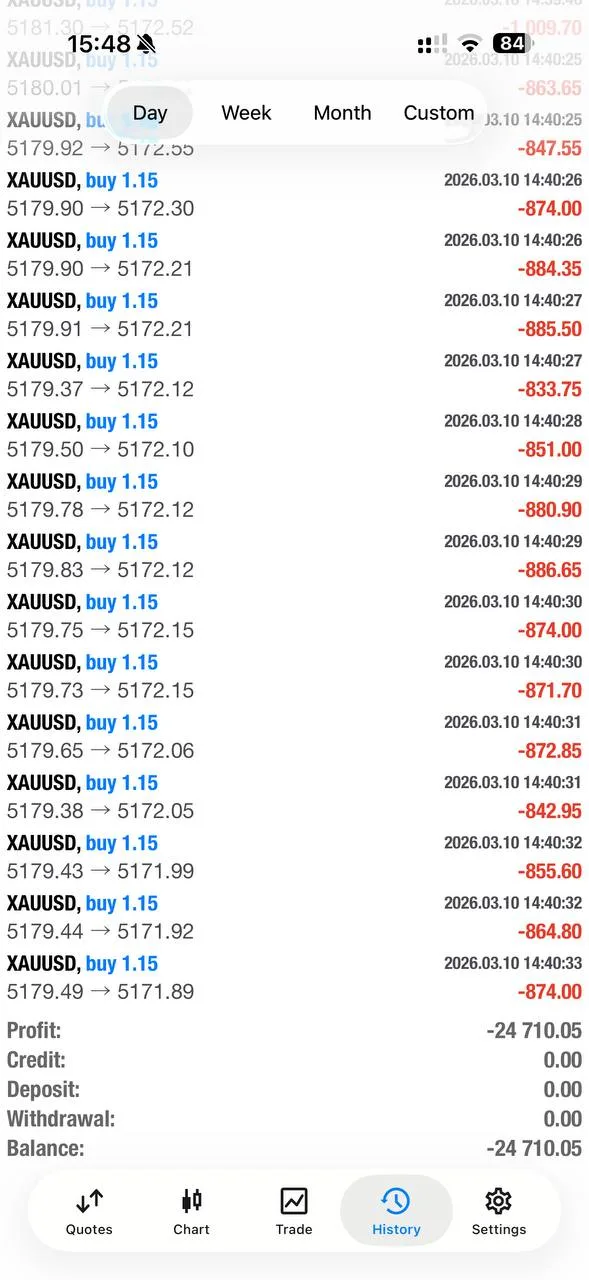
Five signals were issued. The scoreboard was clear: one full winner, one breakeven trade with locked partial profit, and three losses. Net daily P&L finished negative, but one trade was an elite-quality sniper entry that validated the analysis process.
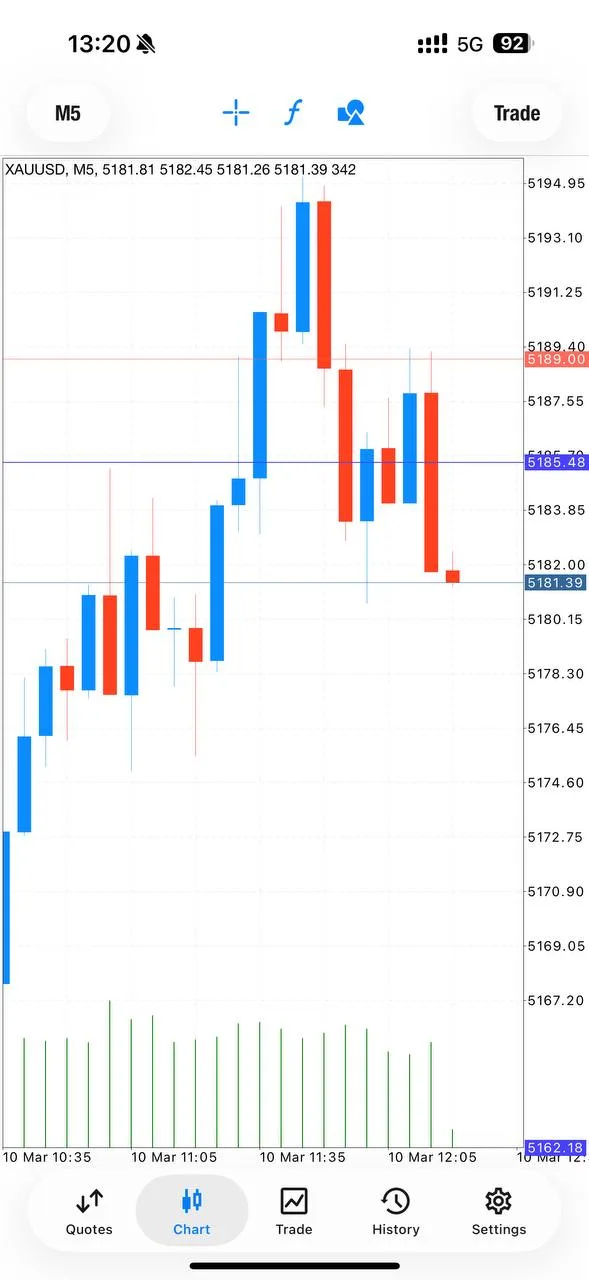
Signal 1 — SELL (09:02 UTC) — Loss#
- Entry: SELL 5182.3–5185.3
- SL: 5189
- TP: 5180 / 5178 / 5176 / Open
- Result: Stopped out or closed quickly after immediate reversal.
Mo's live comments captured the sequence: "Closed trade 🫠" and "Am I being hunted or what🤯." It was an early sign of stop-heavy conditions.
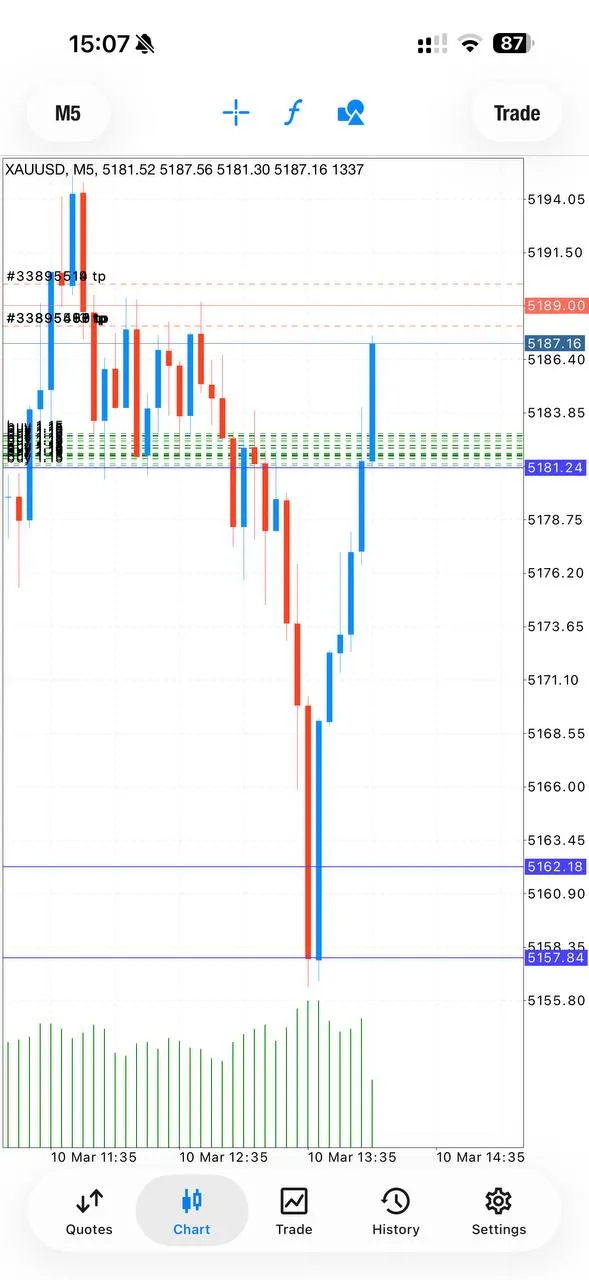
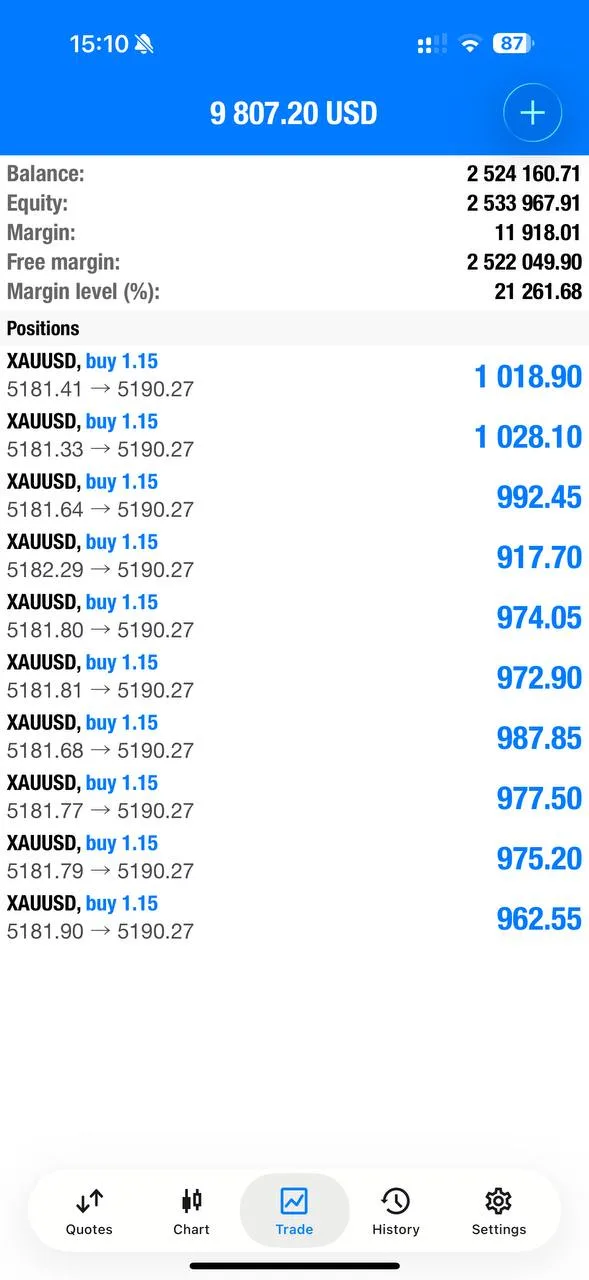
Signal 2 — BUY (11:05 UTC) — Full Win (Sniper)#
- Entry: BUY 5182–5179
- SL: 5176
- TP: 5184 / 5186 / 5188 / 5190 / Open
- Result: All four take-profit levels hit with zero floating drawdown.
This was the trade of the day. Mo called it exactly as it moved: "SNIPERRRR" and "What a zero Floating sniperrrrrr!!!!" Members confirmed complete TP execution, including one trader reporting £400 profit.
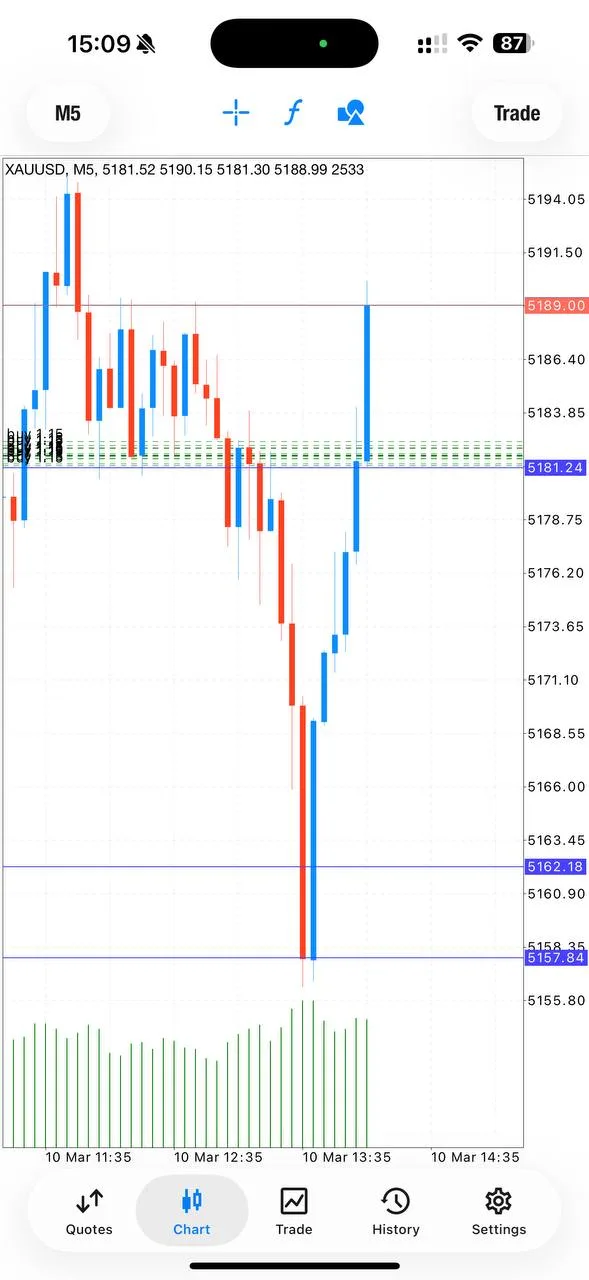
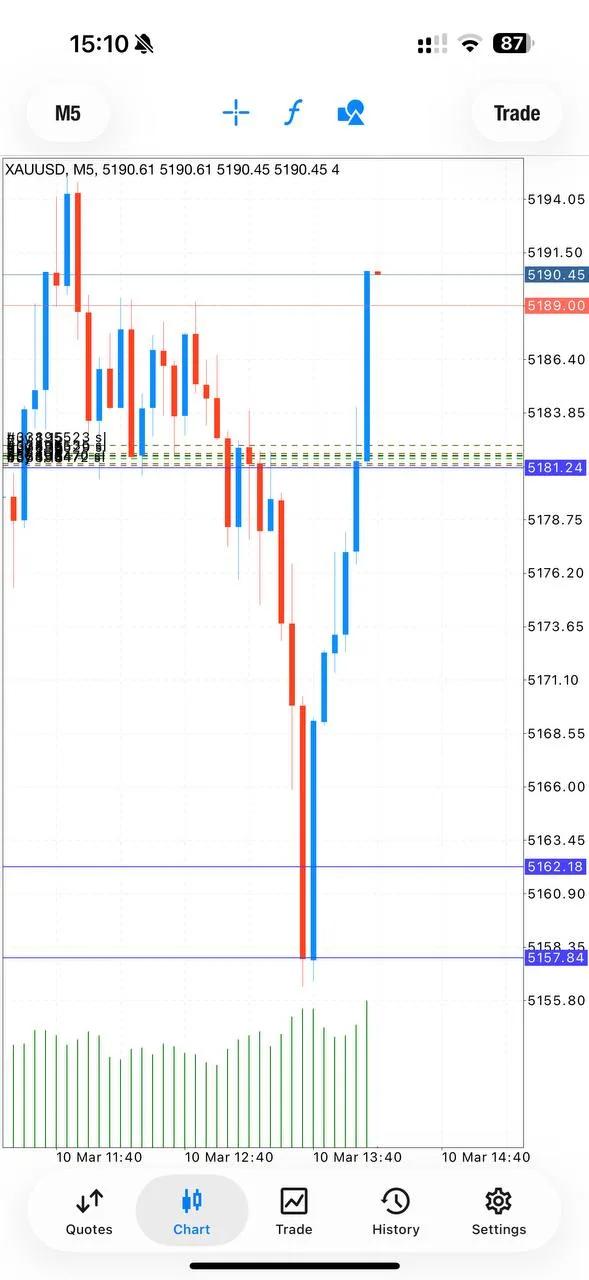
Signal 3 — BUY (11:39 UTC) — Loss (Manual Cut)#
- Entry: BUY 5182–5179
- SL: 5176, then adjusted to 5174 and 5172
- TP: 5184 / 5186 / 5188 / Open
- Result: Manually cut at 11:48 after adverse behavior.
Mo managed this trade actively rather than passively absorbing drawdown, then exited with control.
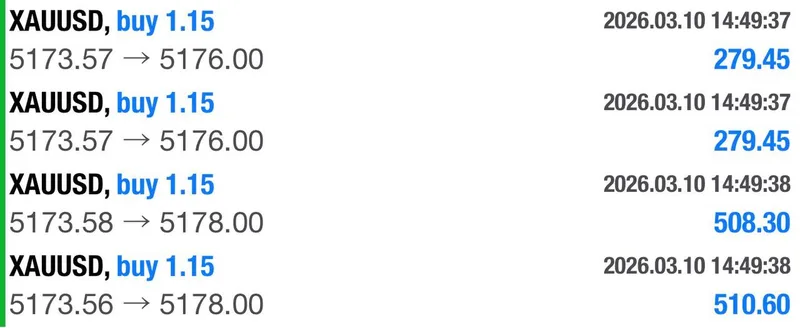
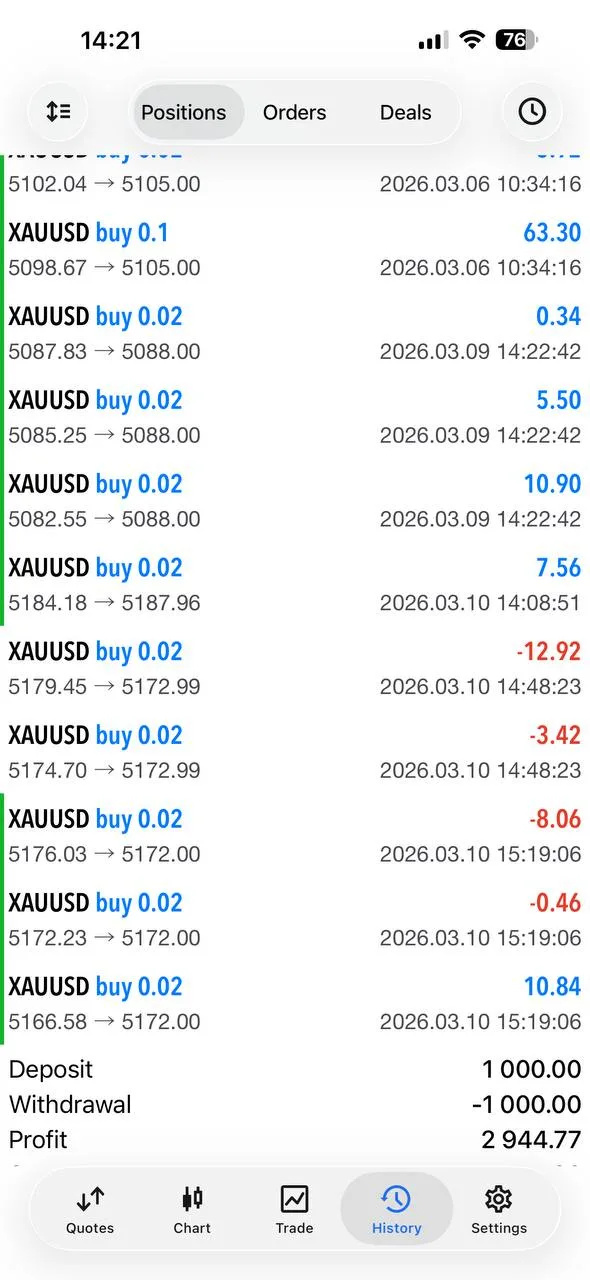
Signal 4 — BUY (11:50 UTC) — Partial Profit, Then Breakeven#
- Entry: BUY 5174–5171
- SL: 5168
- TP: 5176 / 5178 / 5180 / 5182 / 5184 / Open
- Result: TP1 and TP2 hit, remaining position closed at breakeven.
This was a textbook defensive outcome in unstable tape: lock early gains, protect remainder, avoid green-to-red conversion.
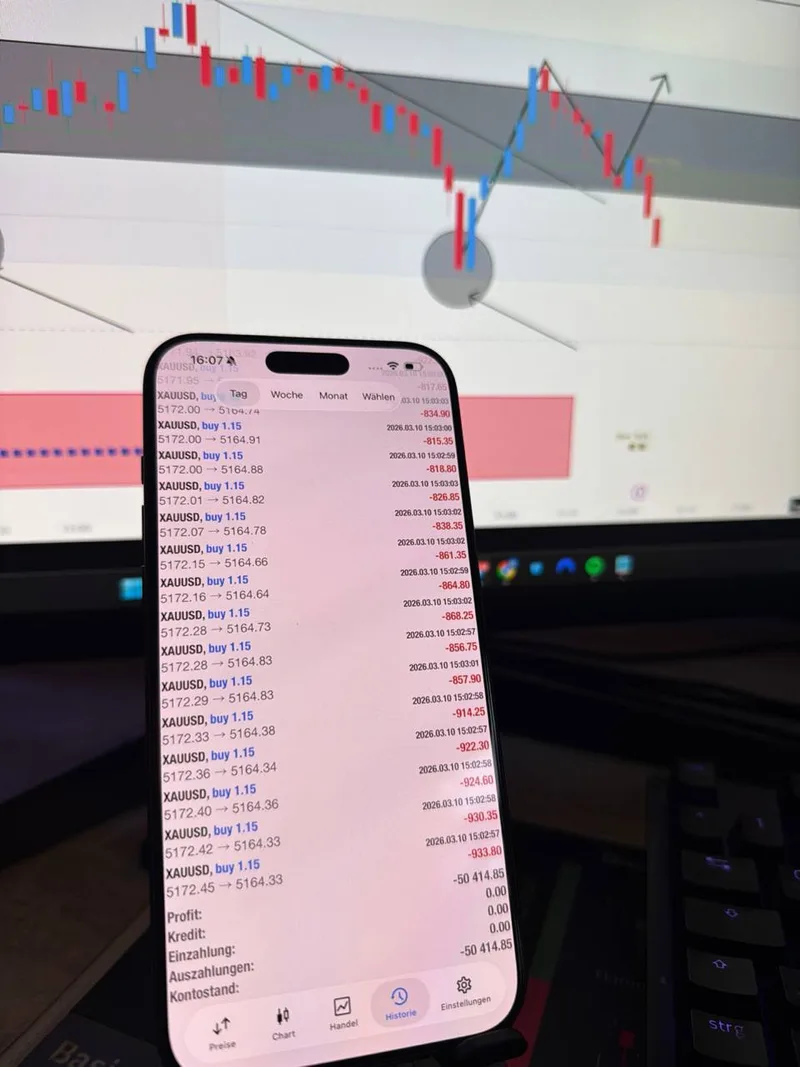
Signal 5 — BUY (12:03 UTC) — Loss#
- Entry: BUY 5172–5169
- SL: 5165
- TP: 5174 / 5176 / 5178 / 5180 / Open
- Result: SL hit at 12:07; market later retraced upward.
Mo ended the session honestly: "I'll jump out of the charts, Gold has simply put me on a losing streak, I'll accept this and get off the charts."
5. Signal Performance Breakdown#
This was a red day financially, and there is no value in dressing that up. Three losses outweighed one full sniper win and one partial-profit/breakeven trade. The useful takeaway is not "ignore the losses"; the useful takeaway is to separate strategic accuracy from tactical friction.
What worked#
The core read on gold's rebound potential was valid, and Signal 2 proved it in the cleanest way possible. A zero-floating-drawdown move through all targets is strong evidence of precision in zone selection and direction. It confirms the analytical framework is still producing high-quality setups.
What hurt#
Repeated stop pressure around clustered levels remained the main tactical issue. On this type of day, market structure hunts obvious risk points before choosing direction. That means traders using tight static stops near crowded levels are exposed even when thesis is ultimately correct.
Why transparency matters#
GTMO does not hide difficult sessions. Every trade, adjustment, emotional note, and closing decision was shared publicly in real time. That practice is central to long-term trust because members can evaluate process quality, not just screenshot outcomes.
Practical lesson for members#
Loss days should be treated as review days, not identity days. The objective is to refine execution under stress, protect capital, and preserve mental stability so the next high-quality setup can be traded properly. For that, revisit the guide on staying disciplined when trading gold and compare this session against the directional framework in the weekly gold forecast.
6. Gold Positioning & Flows#
There are no exact day-specific COT/ETF prints confirmed here for March 10, so positioning should be framed in broad context. Managed money net longs remain elevated, which supports the medium-term bullish narrative but also increases sensitivity to liquidation bursts when short-term catalysts hit. Central bank buying continues to provide a structural demand floor, helping absorb deeper pullbacks over time.
ETF flows have been mixed recently, signaling participation without uniform conviction on every session. In practice, that combination often produces the same behavior seen today: strong rebound potential inside a structurally bullish market, but with sharp intraday stop-outs before cleaner extensions.
7. Community Results#

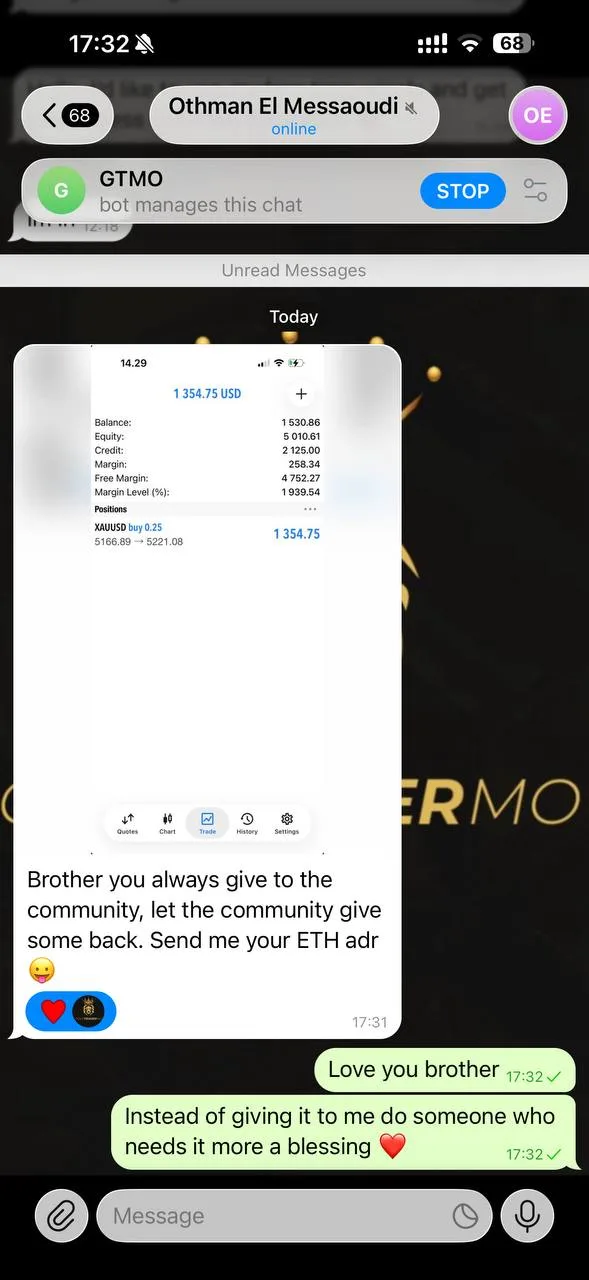
The strongest part of March 10 was community behavior under pressure. Members saw the full reality of a mixed day during a losing streak, and they responded with support.
Real messages from the channel reflected that tone:
"Mo, please remember that you are amazing, what you are doing for the community is unreal. The learning days are nowhere near as much as the winning days and these things happen in trading all the time. Keep your head up. We are grateful for you"
"We all are experiencing the same emotions, we all know this is temporary. Focus on your loved ones. The blue days are coming soon. Best, T."
"i managed to stay on the trade and made profit but we will be here always to support. thanks for the love."
"I am £400 up today thank you — Closed all trades — No better way to put it than you it was a sniper"
Mo also reinforced long-view thinking:
"I remember a losing streak 2 years ago, it lasted a little bit more then 2 weeks. We are now in the same scenario, second week, means it can't last that much longer, and the blue days are waiting for us🙏🏽"
"Who survives the tough days, he's the one who deserves the good days🙏🏽"
GTMO School also received 140+ applications during this same session, which shows trust is being built through transparency, not through pretending every day is easy.
8. Event Risk — Next 48 Hours#
No specific confirmed release slate is being pinned for March 10-12 in this report, so the best approach is to track macro risk categories rather than overfit one timestamp.
Fed Speakers#
Monitor Fed commentary for guidance on cut timing and policy confidence. Any shift in tone can rapidly reprice real-yield expectations, which directly impacts gold.
Inflation Data Path#
Upcoming inflation updates remain the highest recurring catalyst. Softer inflation generally supports the bullish gold case through lower real-rate pressure, while hotter readings can trigger temporary liquidation and deeper stop runs.
Mid-March FOMC Positioning#
With mid-March FOMC expectations in focus, pre-positioning flows can amplify intraday volatility even before official decisions. Traders should stay tactical, reduce overexposure, and avoid assuming clean continuation through policy windows.
FAQ#
How many signals were issued on March 10, and what were the results?#
Five signals were issued: one full win (Signal 2), one partial-profit trade that ended breakeven on the remaining position (Signal 4), and three losses (Signals 1, 3, and 5). Net P&L was negative.
Why is Signal 2 considered the sniper trade?#
Signal 2 was a BUY at 5182–5179 that ran through all four listed take-profit levels with zero floating drawdown. It was precise in both entry location and momentum timing, and members confirmed complete execution.
How does GTMO handle losing-streak periods like this?#
By staying transparent and process-focused. GTMO publishes losses and wins in real time, manages risk actively, reviews execution errors openly, and treats tough days as technical and psychological training rather than as something to hide.
10. Connect with Gold Trader Mo#
- 🆓 Free Signals: GTMO Trades
- 💬 Support: @gtmobest
- 📺 YouTube: GTMOFX
- 📸 Instagram: mojirjees
- 🌐 Website: Gold Trader Mo
⚠️ Risk Disclaimer: Trading gold (XAUUSD) carries significant risk. Past performance does not guarantee future results. Only trade with capital you can afford to lose. This content is educational and does not constitute financial advice.