1. Market Snapshot#
March opened with a full-spectrum risk-off shock, and gold reacted exactly like the world’s emergency hedge. While headlines focused on military escalation and energy disruption, intraday execution inside GTMO School produced a different kind of headline: two completed XAUUSD buy plans, five take-profits captured, and more than $17,000 closed in under twenty minutes of active management. If you’re following the Daily Reports archive, this session stands out for both speed and discipline.
The macro backdrop was extreme from the first bell: war-premium in crude, elevated volatility, and persistent uncertainty around Middle East escalation. Even with those conditions, the tactical roadmap remained clear: identify momentum continuation windows, scale risk intelligently, and lock in exposure early with breakeven protections once momentum paid. The result was textbook: high-conviction entries, rapid TP conversion, and controlled downside throughout. This follows a documented February track record where Mo announced $411,594.11 profit (+19% in one month).
Market Dashboard#
| Indicator | Value | Change | Trend |
|---|---|---|---|
| XAUUSD | ~$5,394 | +$116 (+2.21%) | ↑ Strong rally |
| DXY | 97.87–98.25 | +0.66% | ↑ |
| VIX | ~19.86 | Elevated | ↑ |
| 10Y Yield | 3.97% | -2bps | ↓ |
| WTI Crude | $72.61→$82 | +8–13% | ↑↑ Shock |
| Fear & Greed | 43/100 | Fear | — |
Market Regime: RISK-OFF. Safe-haven demand remains dominant, and gold is still the first destination when geopolitical stress and energy shocks hit simultaneously.
2. Macro Drivers Today#
🟢 Driver 1 — US-Iran war escalation and Strait of Hormuz closure (Impact: HIGH)#
This is the anchor narrative of the day. Reports around US-Israeli military strikes on Iran over the Feb 28 weekend, combined with headline flow around the death of Iran’s Supreme Leader and the closure of the Strait of Hormuz, triggered broad defensive positioning across global markets. With roughly one-fifth of global oil transit associated with Hormuz, crude repriced aggressively and amplified inflation-risk concerns. Gold’s gap-and-go behavior into the open reflects a classic stress-period flow: investors reaching for liquid hard-asset protection during regime uncertainty.
🟢 Driver 2 — Falling real yields and structural central-bank demand (Impact: MEDIUM)#
Real-rate drift has remained supportive in the background even before this week’s geopolitical shock. With 10Y TIPS yields around 1.70% and down around 20 bps over the past month, the opportunity cost of holding non-yielding gold has softened. Add persistent official-sector demand—around 585 tonnes per quarter as estimated—and the medium-term floor under bullion remains robust. This matters because geopolitical spikes usually fade; structural demand dynamics are what often prevent deep retracements.
⚪ Driver 3 — Fed hold bias and policy-event sensitivity (Impact: MEDIUM)#
Rate expectations remain relatively stable near the March FOMC window, with FedWatch pricing heavily skewed to a hold. That stability is mildly supportive for gold, but event risk still matters intraday. Today’s ECB Lagarde speech and US ISM Manufacturing release were key catalysts to monitor for policy tone shifts and growth/inflation signal changes. In this regime, traders should assume headline velocity can rapidly overwhelm technical setups, so position sizing and execution speed remain as important as directional conviction.
3. Technical Outlook#
Price structure remains bullish on the higher timeframe while short-term momentum oscillates between extension and consolidation. Gold is currently testing a major upper zone, and the market is deciding whether this is a staging area for another breakout leg or a temporary digestion band before continuation.
Key Support/Resistance Levels#
| Level | Price | Significance |
|---|---|---|
| R3 / Near-ATH | $5,452 | Critical for ATH retest |
| R2 | $5,394 | Current intraday test zone |
| R1 | $5,312 | Recent peak |
| Pivot | $5,242 | Daily pivot |
| S1 | $5,198 | Former breakout zone |
| S2 | $5,171 | Swing low confluence |
| S3 | $5,128 | Deep support |
Trend Structure#
- 20 EMA: ~$5,019
- 50 SMA: ~$4,798
- 100 SMA: ~$4,473
- 200 SMA: ~$3,970
All major moving averages are stacked below spot in full bullish order, which is typically a trend-confirmation signature rather than a late-cycle warning by itself. Unless price loses key pivot zones with acceptance below support, pullbacks are still better interpreted as tactical re-entry opportunities rather than structural reversals.
Momentum Read#
- RSI (14): ~56 (neutral-to-positive, room to extend)
- MACD: Sideways/neutral (momentum pause, not bearish reversal)
This profile suggests trend strength is present but not overheated. There is space for upside continuation if catalysts remain risk-off aligned. For members refining timing models, execution frameworks from the daily gold trading reports remain critical: wait for liquidity pockets instead of chasing expansion candles.
Scenario Matrix#
| Scenario | Probability | Trigger | Target |
|---|---|---|---|
| 🟢 BULL | 45% | Break >$5,452; Iran escalation | $5,600–$5,900 |
| ⚪ BASE | 35% | Hold $5,198–$5,394 | $5,350–$5,450 |
| 🔴 BEAR | 20% | Break <$5,128; ceasefire | $5,000–$5,100 |
The base case remains constructive, but with event-driven volatility, intraday transitions between scenarios can happen quickly. That is exactly why risk mechanics—partial profits and breakeven transitions—made such a large difference in today’s session outcome.
4. Trading Signals#
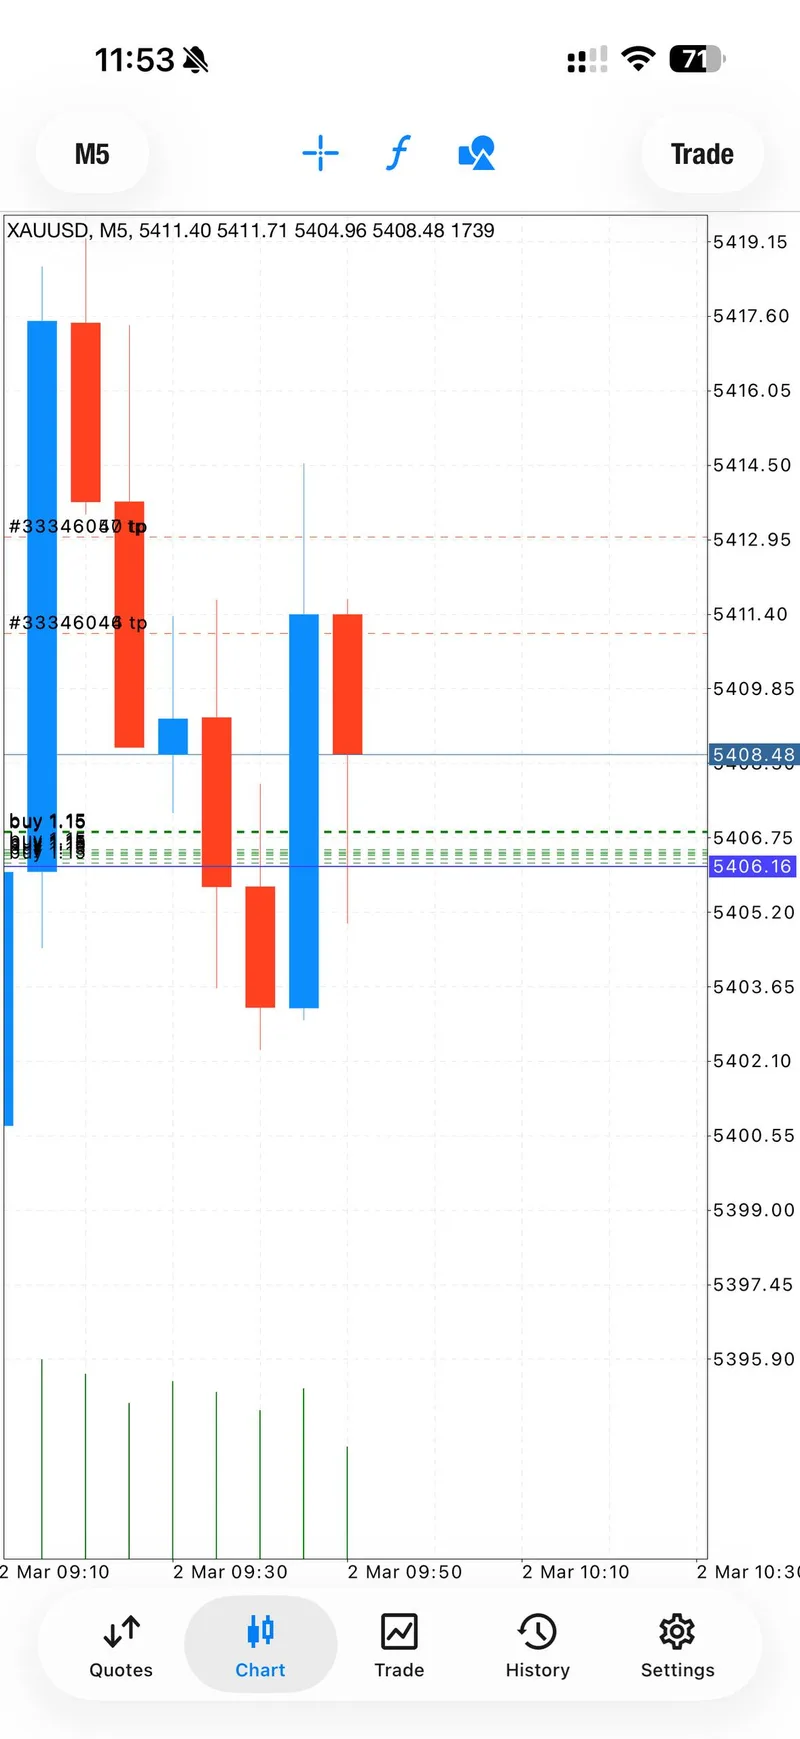
Today’s execution window was concentrated, fast, and high quality. Both setups were BUY-side continuation plans delivered in a risk-off regime where gold had both macro support and intraday momentum.
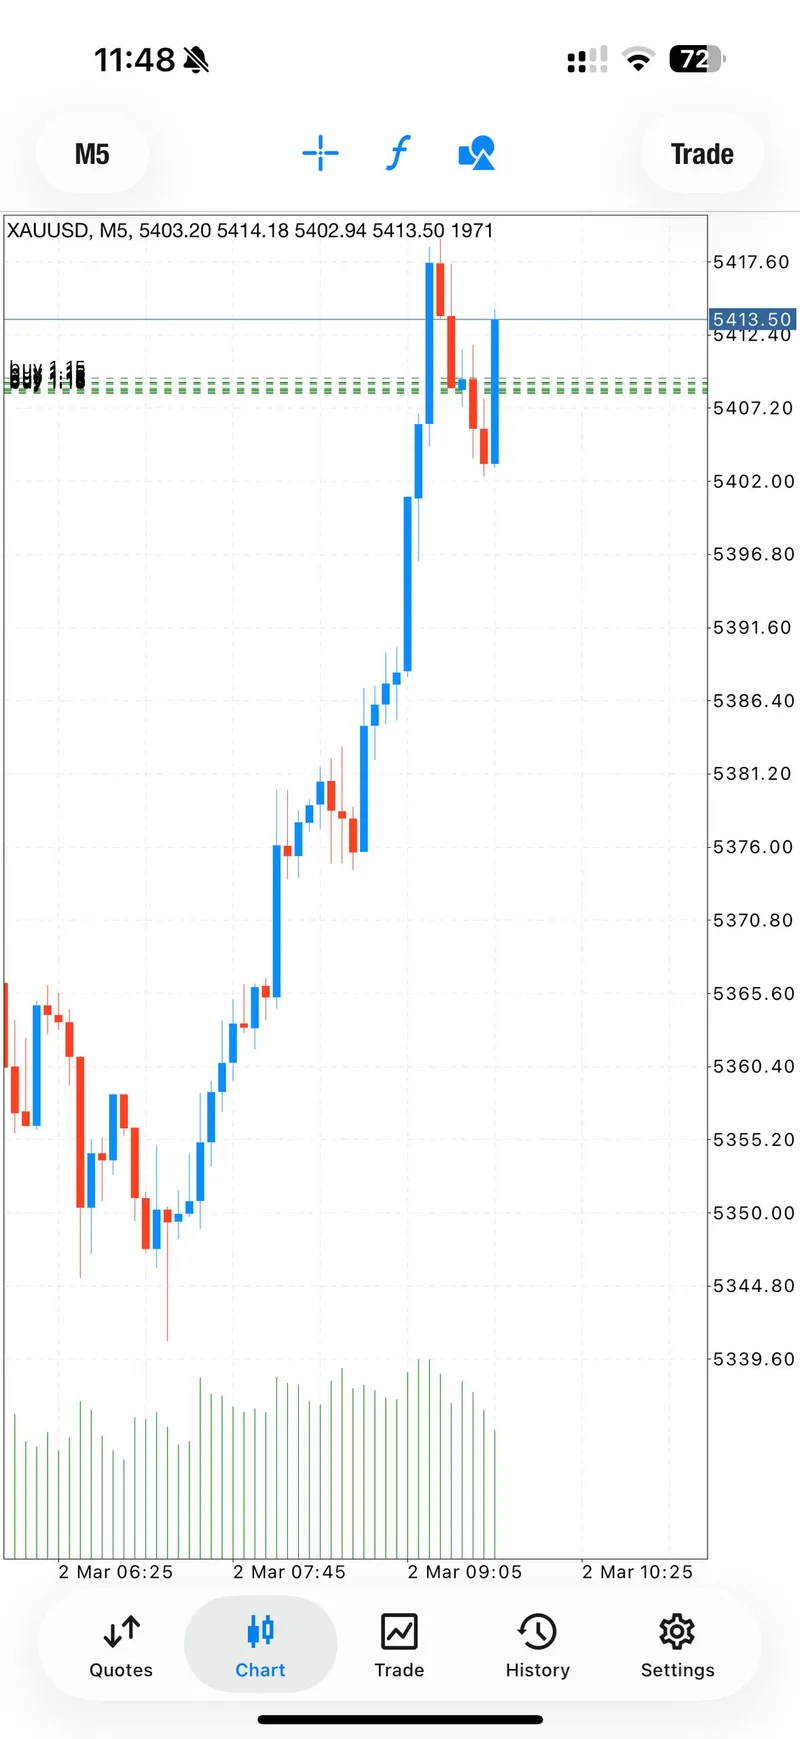
Signal 1 — BUY XAUUSD#
- Signal time: 07:47 UTC
- Entry zone: 5408.5 – 5405
- Stop loss: 5401
- Take profits:
- TP1: 5410 ✅
- TP2: 5412 ✅
- TP3: 5414 ✅
- TP4: Open, then breakeven hit
- Outcome: Three take-profits hit in one candle, then breakeven protection removed remaining risk.
- Execution timeline: TPs triggered by 07:48–07:49 UTC, roughly 1–2 minutes from signal dispatch.
- Trade management note: “3 TakeProfits in one candle, set breakeven for zero risk now!!!”
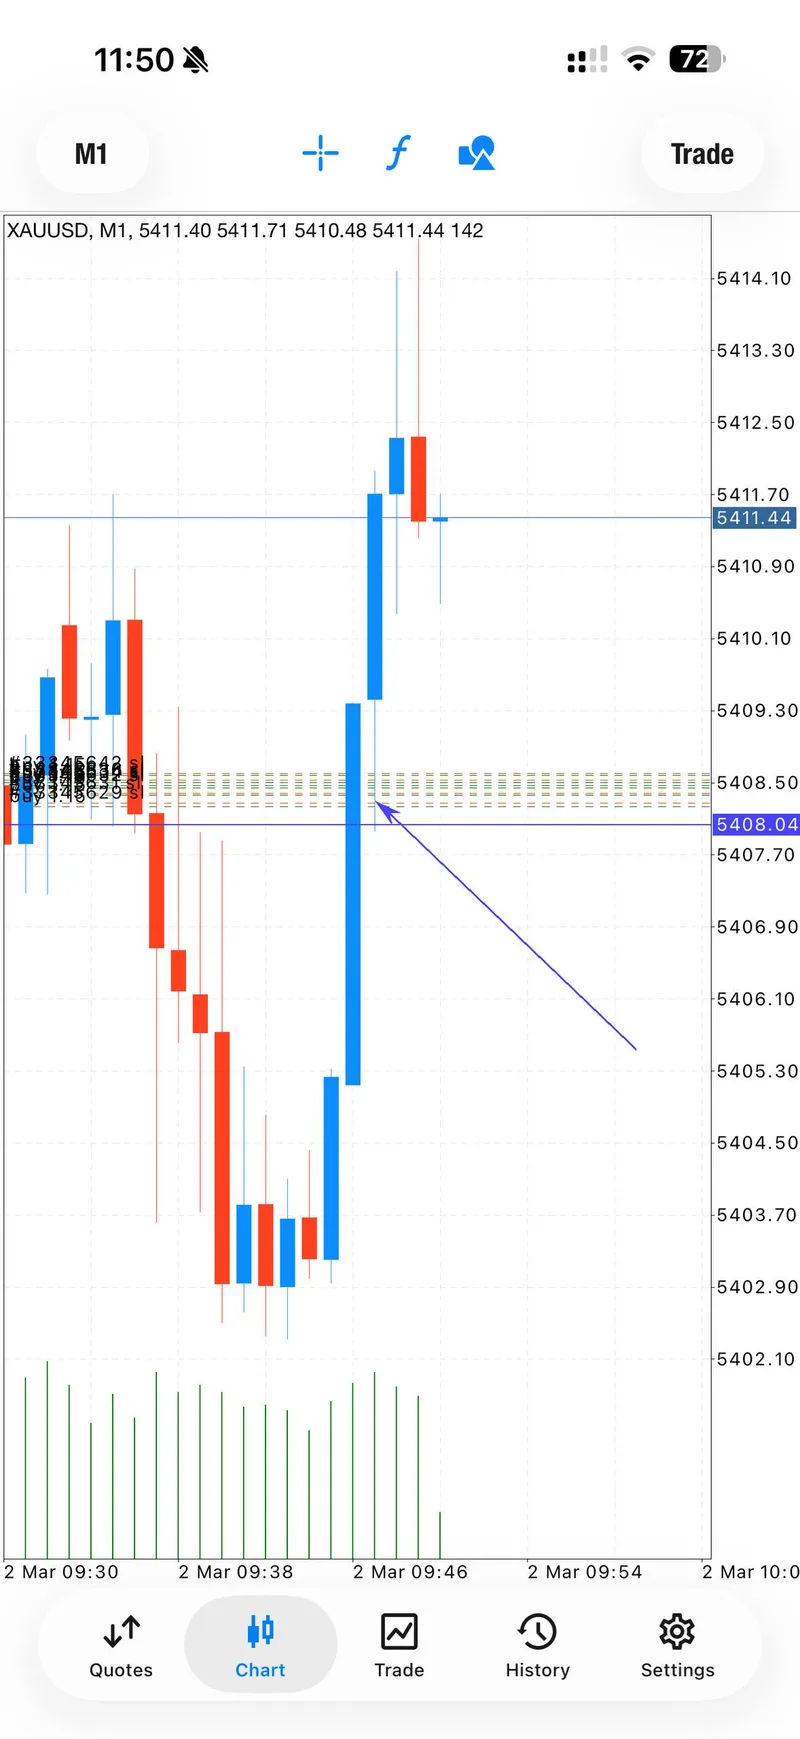
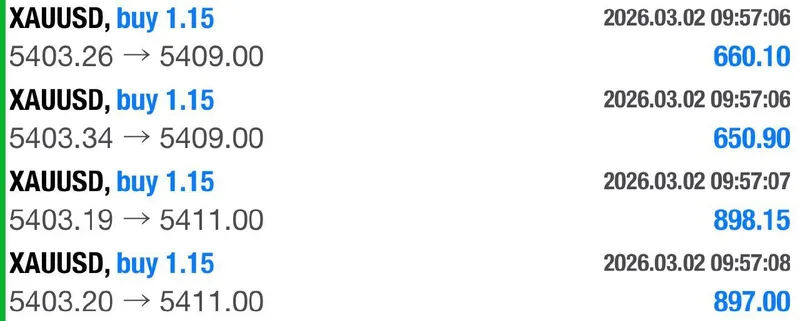
Signal 2 — BUY XAUUSD#
- Signal time: 07:52 UTC
- Entry zone: 5406.6 – 5403
- Stop loss: 5399
- Take profits:
- TP1: 5409 ✅ (under 60 seconds)
- TP2: 5411 ✅
- TP3: 5413 (breakeven hit before TP3)
- Outcome: TP1 and TP2 locked, then breakeven hit after cleanup of weaker entries.
- Execution timeline: TP1 at 07:53 UTC, TP2 by 08:00 UTC.
- Positioning context: 13 lots opened with lower-risk positioning logic.
- Trade management note: Closed worst entries, shifted best entries to breakeven.
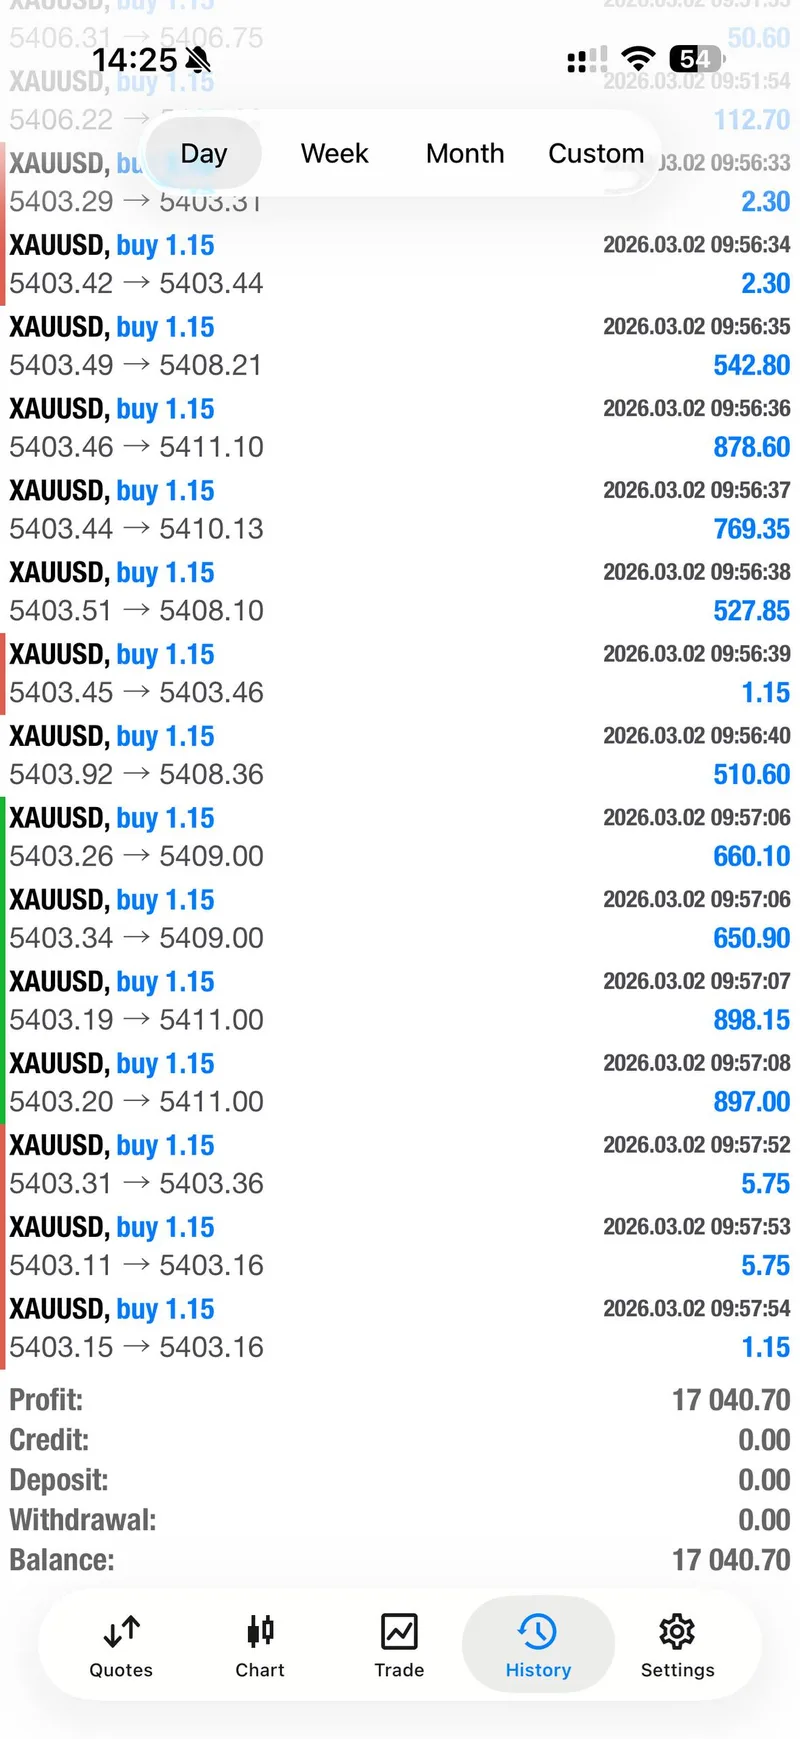
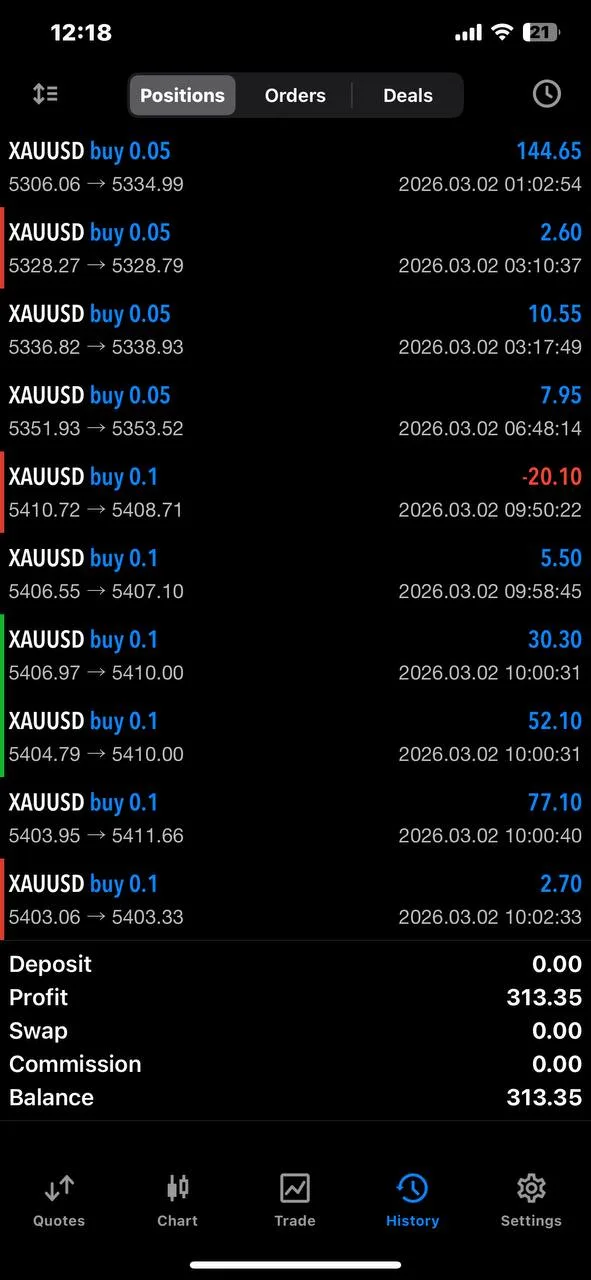
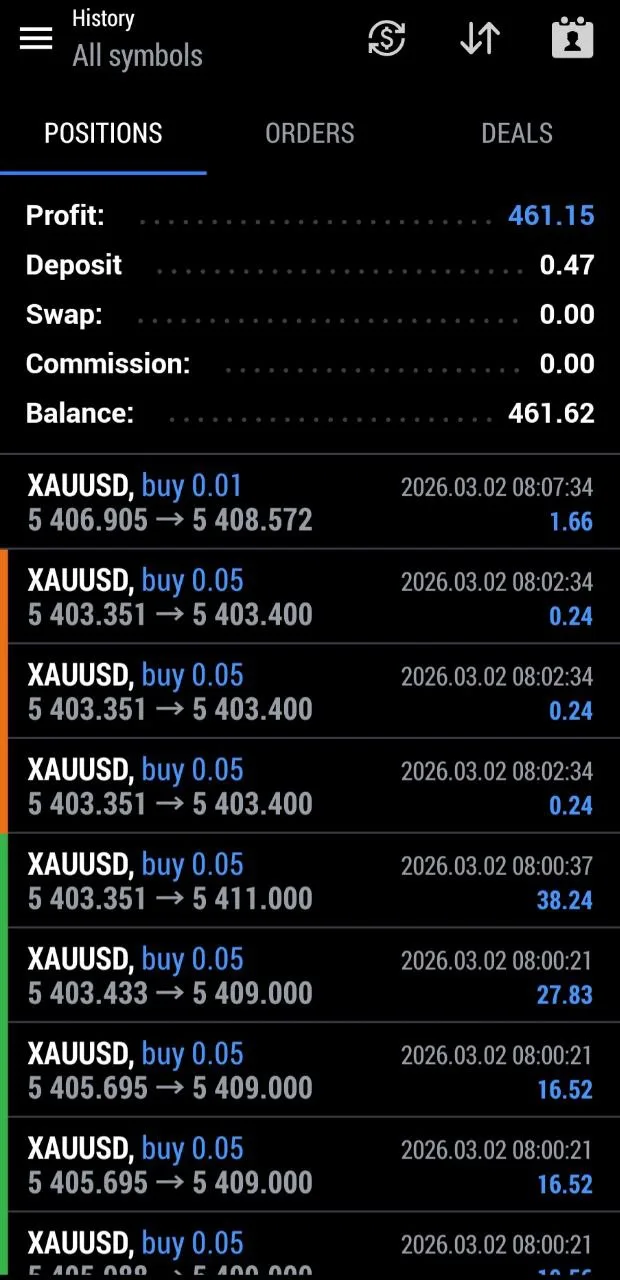
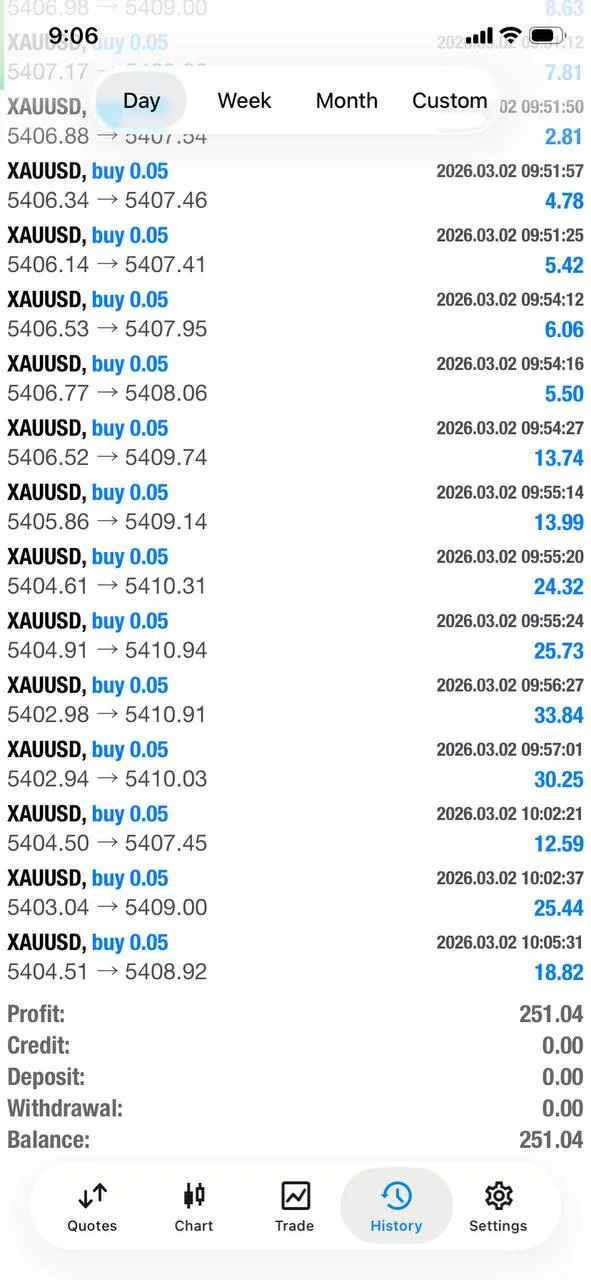
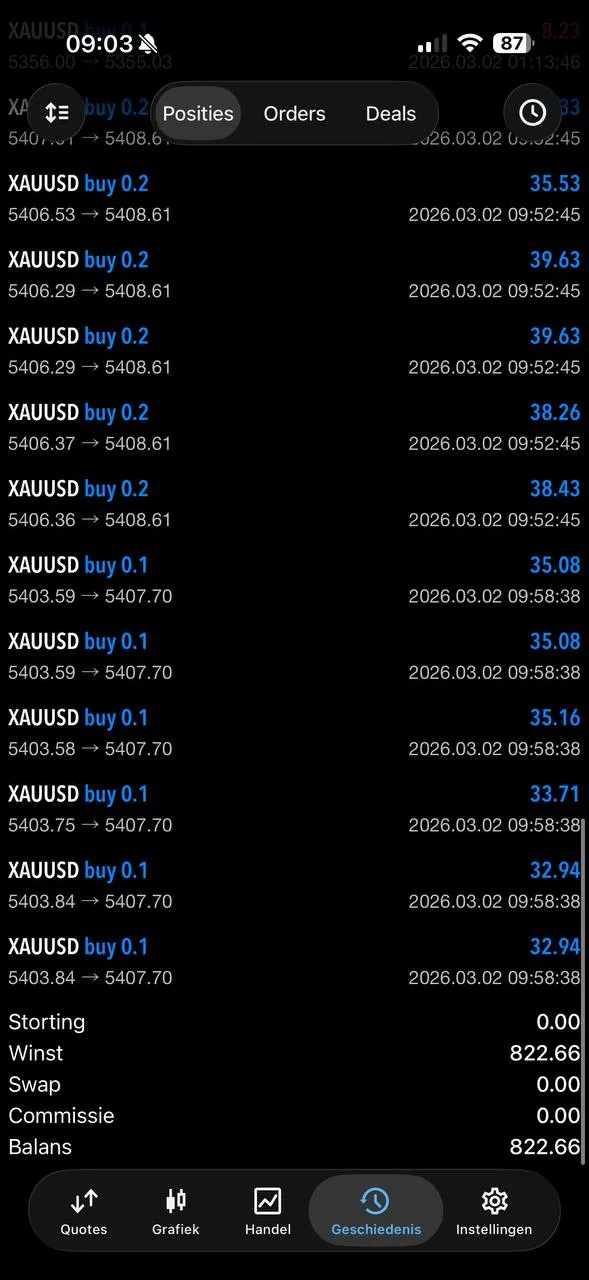
Session Summary#
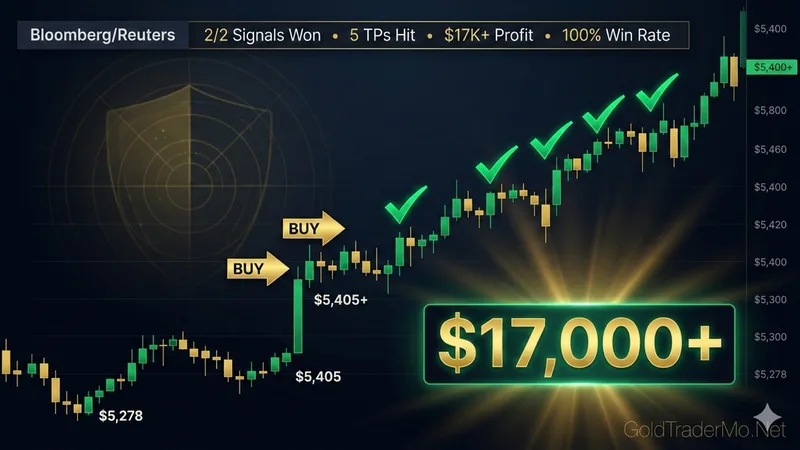
- Win rate: 2/2 signals
- Take-profits hit: 5 total
- Closed profit: $17,000+
- Time-to-result: Majority of performance captured between 07:47 and 08:06 UTC
This is exactly what high-level intraday management should look like in a panic-driven tape: convert momentum fast, protect residual exposure, and avoid turning winners into emotional hold-and-hope positions.
5. Signal Performance Breakdown#
Today was a clear demonstration that edge in gold trading is less about prediction and more about process. The first signal did not just “win”; it accelerated into three targets almost immediately, validating both the entry location and the pre-planned distribution ladder. Capturing three take-profits in one candle is rare, but what matters most is what happened next: breakeven adjustment was called quickly, preserving realized gains while removing downside on the remainder.
The second signal reinforced the same framework under slightly different microstructure conditions. Instead of a one-candle burst through the ladder, this setup delivered an immediate TP1 in under a minute, then extended to TP2 while management filtered weaker entries. Closing worst fills before moving best entries to breakeven is a subtle but powerful tactic that upgrades average trade quality.
Another key point is environmental pressure. Mo was trading from home in Dubai during active regional conflict headlines, including reports of air-defense interception activity in the UAE. In those conditions, many traders either freeze or overtrade. The opposite happened here: concise instructions, controlled leverage framing, and strict protection logic. That discipline is part of why March opened strong immediately after February’s reported $411,594.11 (+19%).
For developing traders, the lesson is not to copy lot size or chase signal speed. The lesson is sequence:
- Define entry band and invalidation before execution.
- Pre-plan exits and convert partials as soon as liquidity pays.
- Transition to breakeven as soon as structure allows.
- Preserve psychological capital by removing open risk after initial success.
When traders ask why some sessions produce outsized returns in minutes, the answer is usually not luck. It is preparation meeting volatility with predefined rules. If you want to internalize that system behavior, review the process models in our gold trading signals archive and compare them line-by-line against today’s timeline.
6. Gold Positioning & Flows#
Positioning data shows a market that is crowded long, but still supported by deep structural demand. Latest COT snapshots show net speculative length around 212,808 contracts (roughly -1,700 week-over-week, or -0.8%). That mild reduction looks more like tactical trimming than a full sentiment unwind.
ETF flow confirms the longer-term bid remains very strong. January 2026 inflows were reported near +120 tonnes, lifting total gold ETF holdings to roughly 4,145 tonnes, with aggregate AUM around $669 billion. In parallel, daily trading turnover around $23 billion/day and sharply higher month-on-month indicates participation breadth is expanding.
Why this matters for tactical traders:
- Strong flow backdrop means pullbacks can be shallower than expected.
- Crowded long conditions can still create abrupt intraday flushes.
- Geopolitical premium can magnify both upside spikes and stop hunts.
In practical terms, flow data does not replace execution signals; it sets the context for what kind of pullback behavior is most likely. Today’s outcomes fit that profile: broad directional support for gold, fast bursts through resistance, and then choppy consolidations that reward traders who secure profits early rather than hold full size into headline noise.
For members tracking consistency, this is another reason to blend top-down macro awareness with bottom-up trade management. Macro decides direction bias; execution rules decide whether you keep the money.
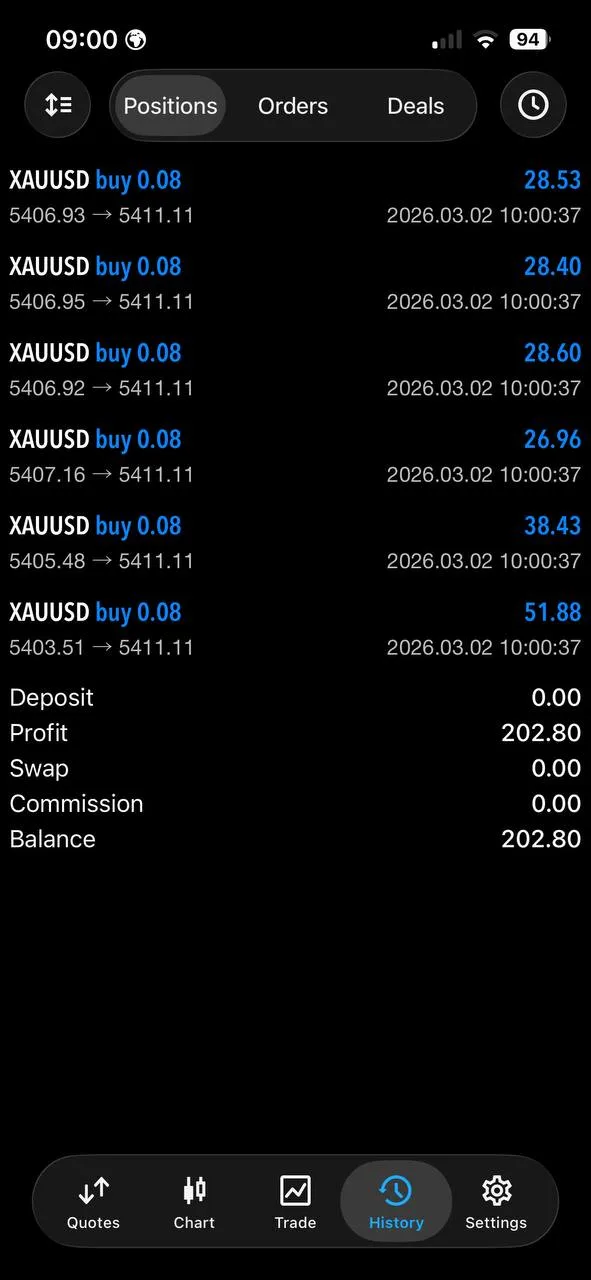
7. Community Results#
The strongest validation of a trading session is not just PnL totals—it is how many members were able to execute cleanly and lock tangible outcomes. Today delivered that across the board: fast targets, clear management language, and a high-confidence tone from the community from the open.
The broader emotional context also matters. Members were trading through an unusually tense geopolitical session, with real safety concerns discussed across chats. Despite that backdrop, the room stayed focused on process: entries, exits, and protection.
"GTMO SCHOOL AGAIN!!!! PERFECT START FOR MARCH!! Thank you for everything Mo.." — Jovan
"Well that was a very quick £500... What a start to the month 💰🙏" — Kirk Jones
"Thanks Sir for making us profits even in the war situation in UAE. I wish safety and prosperity for you and your family." — Nazim Raza
"Monster MO!!!!!" — Tini
"Blessed Monday already Big Mo !!! God bless you 🙏" — Me
"Blues from dubai 😅❤️" — Ahsan Azhardeen
These responses are consistent with what the signal tape shows: speed, clarity, and disciplined risk reduction. When a room can capture performance and remain composed during geopolitical stress, that reflects training and leadership continuity.
8. Event Risk — Next 48 Hours#
The next two sessions still carry significant macro event risk. Even in a geopolitically dominated tape, scheduled releases can shape intraday liquidity and trigger fast repricing, particularly when market positioning is already heavy.
| Date/Time (UTC) | Event | Previous | Forecast | Gold Impact |
|---|---|---|---|---|
| Mar 2, 14:00 | ECB Lagarde Speech | — | — | MEDIUM |
| Mar 2, 15:00 | US ISM Manufacturing PMI | 52.6 | 51.3 | MEDIUM |
| Mar 4, 13:15 | US ADP Employment | 45K | 19K | MEDIUM |
| Mar 4, 15:00 | US ISM Services PMI | 54 | 53 | MEDIUM |
| Mar 6, 13:30 | US NFP + Unemployment | — | — | HIGH |
Risk Notes for Traders#
- Headline overlap risk: Macro releases can coincide with geopolitical updates, producing non-linear spikes.
- Spread expansion windows: Around high-impact data, execution quality can degrade quickly.
- Trend interruption probability: Even strong trend days can reverse intraday if incoming data challenges growth or inflation assumptions.
Given today’s strong start to March, preserving gains should be as important as pursuing continuation. Traders with profits on the week should prioritize high-quality setups and avoid forcing exposure ahead of major US labor data.
FAQ#
1) Why did gold rally so aggressively while other assets looked unstable?#
Gold typically benefits when markets shift to defense mode. Today combined geopolitical conflict risk, energy supply disruption, and elevated volatility expectations, all of which support safe-haven demand. If you want broader context on recurring patterns, follow ongoing updates in the daily market reports hub.
2) Is it too late to buy after a big move like this?#
Late chasing is usually lower quality than waiting for structured entries around key levels. In trend conditions, disciplined pullback participation often outperforms impulse buying at expansion highs. The framework in our gold trading signals archive explains entry timing, invalidation logic, and breakeven transitions used in fast sessions like today.
3) Why use breakeven so quickly after TP hits?#
Because volatility can reverse without warning during headline-driven sessions. Moving to breakeven after partial profit converts open-risk exposure into an asymmetrical profile: you keep realized gains while protecting capital on the remainder. This is central to sustainable intraday execution.
4) How should beginners interpret “13 lots opened” in a signal recap?#
Lot size is account-specific and should never be copied blindly. Focus on structure first: setup quality, stop distance, risk per trade, and management discipline. New traders should start with educational walkthroughs and session recaps before scaling, including resources available across the Gold Trader Mo blog.
5) What should I watch next if conflict headlines cool down?#
If geopolitical intensity fades, watch whether price can hold above key support bands (especially the pivot/S1 region). A failure to hold can trigger deeper mean reversion; a stable hold keeps continuation odds alive. Monitor scheduled data and tactical updates through the latest report stream.
10. Connect with Gold Trader Mo#
Stay connected for live signal updates, education, and community support:
- 🆓 Free Signals: GTMO Trades
- 💬 Support: @gtmobest
- 📺 YouTube: GTMOFX
- 📸 Instagram: mojirjees
- 🌐 Website: Gold Trader Mo
Weekly Summary Context#
This day is part of our weekly gold trading summary for March 2-6.
Risk Disclaimer: Trading leveraged products, including gold (XAUUSD), involves substantial risk and may not be suitable for all investors. Past performance, including today’s signal outcomes and prior monthly results, does not guarantee future returns. Always use a predefined stop loss, manage position size according to your own risk tolerance, and never trade with capital you cannot afford to lose.